
Mathematics, 28.07.2019 04:33 wiljoystoltz253
The ratio of people who walk home from school to people who ride the bus home is 2 : 7. the number of bus riders is how many times the number of walkers?

Answers: 2
Another question on Mathematics
Mathematics, 21.06.2019 16:00
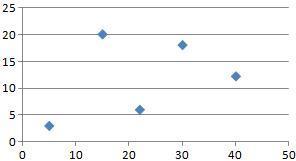
Part one: measurements 1. measure your own height and arm span (from finger-tip to finger-tip) in inches. you will likely need some from a parent, guardian, or sibling to get accurate measurements. record your measurements on the "data record" document. use the "data record" to you complete part two of this project. name relationship to student x height in inches y arm span in inches archie dad 72 72 ginelle mom 65 66 sarah sister 64 65 meleah sister 66 3/4 67 rachel sister 53 1/2 53 emily auntie 66 1/2 66 hannah myself 66 1/2 69 part two: representation of data with plots 1. using graphing software of your choice, create a scatter plot of your data. predict the line of best fit, and sketch it on your graph. part three: the line of best fit include your scatter plot and the answers to the following questions in your word processing document 1. 1. which variable did you plot on the x-axis, and which variable did you plot on the y-axis? explain why you assigned the variables in that way. 2. write the equation of the line of best fit using the slope-intercept formula $y = mx + b$. show all your work, including the points used to determine the slope and how the equation was determined. 3. what does the slope of the line represent within the context of your graph? what does the y-intercept represent? 5. use the line of best fit to you to describe the data correlation.
Answers: 2
Mathematics, 21.06.2019 22:00
20 points 1. your friend, taylor, missed class today and needs some identifying solutions to systems. explain to taylor how to find the solution(s) of any system using its graph. 2. taylor graphs the system below on her graphing calculator and decides that f(x)=g(x) at x=0, x=1, and x=3. provide taylor some feedback that explains which part of her answer is incorrect and why it is incorrect. f(x)=2x+1 g(x)=2x^2+1
Answers: 2
Mathematics, 21.06.2019 22:00
The two box p digram the two box plots show the data of the pitches thrown by two pitchers throughout the season. which statement is correct? check all that apply. pitcher 1 has a symmetric data set. pitcher 1 does not have a symmetric data set. pitcher 2 has a symmetric data set. pitcher 2 does not have a symmetric data set. pitcher 2 has the greater variation.ots represent the total number of touchdowns two quarterbacks threw in 10 seasons of play
Answers: 1
You know the right answer?
The ratio of people who walk home from school to people who ride the bus home is 2 : 7. the number...
Questions


Social Studies, 28.08.2019 04:10
Mathematics, 28.08.2019 04:10
Mathematics, 28.08.2019 04:10
Mathematics, 28.08.2019 04:10

Mathematics, 28.08.2019 04:10
Mathematics, 28.08.2019 04:10
Mathematics, 28.08.2019 04:10
Mathematics, 28.08.2019 04:10

Mathematics, 28.08.2019 04:10


