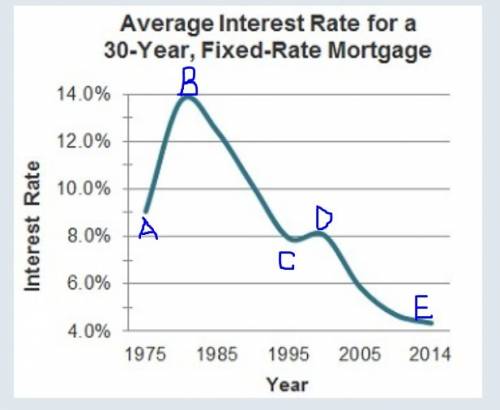
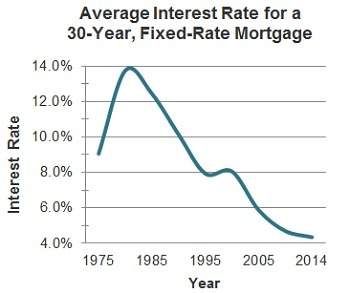
The graph shows changes in interest rates since 1975.
what best sums up the information...

Mathematics, 01.02.2020 01:01 willcoop6470
The graph shows changes in interest rates since 1975.
what best sums up the information shown on the graph?
interest rates can go up and down.
interest rates can only go down.
interest rates can only go up.
interest rates show little change over time.

Answers: 3
Another question on Mathematics
Mathematics, 21.06.2019 16:20
Abank gives 6.5% interest per year. what is the growth factor b in this situation?
Answers: 3
Mathematics, 21.06.2019 16:30
The average human heart beats 1.15 \cdot 10^51.15⋅10 5 1, point, 15, dot, 10, start superscript, 5, end superscript times per day. there are 3.65 \cdot 10^23.65⋅10 2 3, point, 65, dot, 10, start superscript, 2, end superscript days in one year.how many times does the heart beat in one year? write your answer in scientific notation, and round to one decimal place.
Answers: 1
Mathematics, 21.06.2019 22:00
Find two numbers if their sum is 91 and the ratio is 6: 7?
Answers: 1
You know the right answer?
Questions
Mathematics, 15.01.2022 04:00


English, 15.01.2022 04:00
Mathematics, 15.01.2022 04:00
Mathematics, 15.01.2022 04:00

Social Studies, 15.01.2022 04:00

History, 15.01.2022 04:00
Mathematics, 15.01.2022 04:00

Spanish, 15.01.2022 04:00
History, 15.01.2022 04:00


