
Mathematics, 27.07.2019 08:30 IntellTanito
Meg plotted the graph below to show the relationship between the temperature of her city and the number of sweaters sold at a store: main title on the graph is sweater sale. graph shows 0 to 30 on x axis at increments of 5 and 0 to 12 on y axis at increments of 1. the label on the x axis is temperature in degree c, and the label on the y axis is number of sweaters sold. dots are made at the ordered pairs 0, 12 and 2.5, 10 and 2.5, 11 and 5, 10 and 7.5, 9 and 7.5, 10 and 10, 7 and 12.5, 6 and 12.5, 8 and 15, 4 and 15, 7 and 17.5, 5 and 20, 1 and 20, 3 and 22.5, 9 and 25, 1 and 27.5, 1. part a: in your own words, describe the relationship between the temperature of the city and the sale of sweaters in the city. part b: describe how you can make the line of best fit. write the approximate slope and y-intercept of the line of best fit. show your work, including the points that you use to calculate slope and y-intercept.

Answers: 1
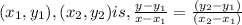
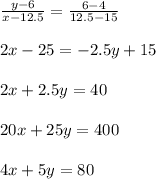

 , Y- intercept = 16
Another question on Mathematics
Mathematics, 21.06.2019 18:00
The price of an item has been reduced by 30%. the original price was $30. what is the price of the item now ?
Answers: 1
Mathematics, 21.06.2019 18:30
Barbara deposited $300 in the bank. if the bank pays her simple interest at the rate of 4 percent per year, how much money will she have in her account at the end of 9 months?
Answers: 1
Mathematics, 21.06.2019 19:30
According to the data set, where should the upper quartile line of the box plot be placed?
Answers: 1
Mathematics, 21.06.2019 22:30
Which statement shows that 6.24 is a rational number? a. 6.24 = 6.242424 b. 6.24 = 6.24 c. 6.24 = 68⁄33 d. 6.24 = 66⁄25
Answers: 1
You know the right answer?
Meg plotted the graph below to show the relationship between the temperature of her city and the num...
Questions
Mathematics, 20.08.2019 09:30
Mathematics, 20.08.2019 09:30
Mathematics, 20.08.2019 09:30

History, 20.08.2019 09:30

Mathematics, 20.08.2019 09:30
History, 20.08.2019 09:30
Biology, 20.08.2019 09:30
History, 20.08.2019 09:30
History, 20.08.2019 09:30

English, 20.08.2019 09:30

Social Studies, 20.08.2019 09:30
History, 20.08.2019 09:30

Physics, 20.08.2019 09:30


