
Mathematics, 24.09.2019 16:30 Laylahlettiere
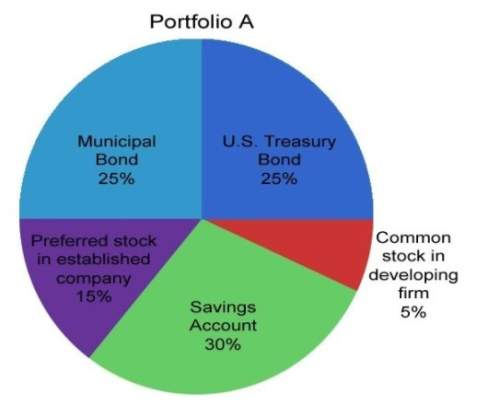
Evaluate the diversity of this portfolio. explain, using complete sentences, if this portfolio is not diverse, minimally diverse, somewhat diverse, or extremely diverse. why?
describe the risk factor of this portfolio. is this an aggressive, conservative, or moderate portfolio? how do you know?
describe an individual who might carry this type of portfolio. include details such as age, occupation, family situation, investment goals.

Answers: 1
Another question on Mathematics
Mathematics, 21.06.2019 17:40
The graph of y = ax^2 + bx + c is a parabola that opens up and has a vertex at (0, 5). what is the solution set of the related equation 0 = ax%2 + bx + c?
Answers: 2
Mathematics, 21.06.2019 18:30
Apsychology student wishes to investigate differences in political opinions between business majors and political science majors at her college. she randomly selects 100 students from the 260 business majors and 100 students from the 180 political science majors. does this sampling plan result in a simple random sample? why or why not? no, because each group of 200 students in the sample does not have the same chance of being selected. yes, because each group of 200 students in the sample has the same chance of being selected. no, because each individual student does not have an equal chance of being selected. yes, because each individual student has the same chance of being selected.
Answers: 1
Mathematics, 21.06.2019 19:30
Cor d? ? me ? max recorded the heights of 500 male humans. he found that the heights were normally distributed around a mean of 177 centimeters. which statements about max’s data must be true? a) the median of max’s data is 250 b) more than half of the data points max recorded were 177 centimeters. c) a data point chosen at random is as likely to be above the mean as it is to be below the mean. d) every height within three standard deviations of the mean is equally likely to be chosen if a data point is selected at random.
Answers: 1
Mathematics, 22.06.2019 02:30
Which statement best explains whether the table represents a linear or nonlinear function? input (x) output (y) 2 5 4 10 6 15 8 20 it is a linear function because the input values are increasing. it is a nonlinear function because the output values are increasing. it is a linear function because there is a constant rate of change in both the input and output. it is a nonlinear function because there is a constant rate of change in both the input and output.
Answers: 3
You know the right answer?
Evaluate the diversity of this portfolio. explain, using complete sentences, if this portfolio is no...
Questions

Computers and Technology, 09.09.2020 22:01

English, 09.09.2020 22:01


Mathematics, 09.09.2020 22:01

Business, 09.09.2020 22:01

Computers and Technology, 09.09.2020 22:01
Mathematics, 09.09.2020 22:01


Chemistry, 09.09.2020 22:01
Computers and Technology, 09.09.2020 22:01


