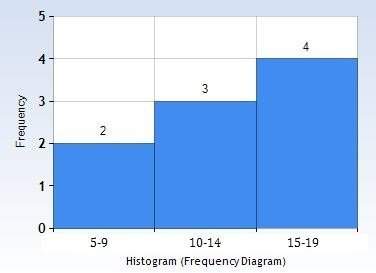
Which data set could not be represented by the histogram?
a) {12, 12, 15, 9, 8, 17, 11, 16,...

Mathematics, 25.09.2019 21:30 cam6836
Which data set could not be represented by the histogram?
a) {12, 12, 15, 9, 8, 17, 11, 16, 15}
b) {13, 10, 15, 9, 9, 18, 19, 14, 15}
c) {12, 17, 19, 9, 8, 17, 18, 14, 16}
d) {13, 10, 16, 9, 8, 17, 18, 14, 15}

Answers: 1
Another question on Mathematics
Mathematics, 21.06.2019 14:00
Tiara buys the pizza shown below: a circular pizza is shown. the edge of one slice is marked ab. what does the curve ab represent?
Answers: 1
Mathematics, 21.06.2019 20:30
Someone answer asap for ! michele pushes a box d meters across a floor. she uses a force f, in newtons, to push the box. she pushes the box for t seconds. the formula p = fd/t calculates the power, p, in watts, that it takes for michele to complete the task. solve the formula for d.
Answers: 2
Mathematics, 21.06.2019 21:40
Which of the following best describes the graph below? + + 2 + 3 + 4 1 o a. it is not a function. o b. it is a one-to-one function. o c. it is a many-to-one function. o d. it is a function, but it is not one-to-one.
Answers: 3
Mathematics, 21.06.2019 23:20
The graph of y=x3 is transformed as shown in the graph below. which equation represents the transformed function?
Answers: 1
You know the right answer?
Questions
Mathematics, 19.02.2021 19:20

Biology, 19.02.2021 19:20

Mathematics, 19.02.2021 19:20
Mathematics, 19.02.2021 19:20
Mathematics, 19.02.2021 19:20


History, 19.02.2021 19:20
Mathematics, 19.02.2021 19:20
Mathematics, 19.02.2021 19:20

Mathematics, 19.02.2021 19:20
Mathematics, 19.02.2021 19:20

Physics, 19.02.2021 19:20


