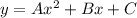
 . Substituting the data into the calculator we get the equation:
  .
.
 . According to the calculator, the exponential regression equation is
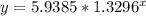

Nstructions:
view the video found on page 1 of this journal activity.
using the i...

Mathematics, 12.11.2019 02:31 erinwebsterrr
Nstructions:
view the video found on page 1 of this journal activity.
using the information provided in the video, answer the questions below.
show your work for all calculations.
here are the data for the hypothetical (or imagined) rabbit population.
year (x) 0 1 2 3 4 5 6 7 8 9 10
number of rabbits (y) 6 8 10 14 19 25 33 43 57 77 104
1. looking at the data, does this rabbit growth look linear, quadratic, or exponential? explain your answer.
(1 point)
2. make a scatterplot for the data. (2 points)
3. looking at the scatterplot, which regression model do you think fits the data? explain your answer.
(1 point)
4. using a graphing calculator, find the quadratic regression equation for the rabbit data.
(2 points: 1 point for identifying constants, 1 for the equation)
5. using the quadratic regression equation from question 4, predict the number of rabbits in year 70.
(2 points: 1 point for setting up the correct equation, 1 for simplifying)
6. using a graphing calculator, find the exponential regression equation for the rabbit data.
(2 points: 1 point for identifying the constants, 1 for the equation)
7. using the exponential regression equation from question 6, predict the number of rabbits in year 70.
(2 points: 1 point for setting up the correct equation, 1 for simplifying)
8. compare the predicted number of rabbits for year 70 using the quadratic model (question 5) with the predicted number using the exponential model (question 7). which prediction is larger? (1 point)
9. is it reasonable to use this data set to predict the hypothetical number of rabbits for year 70? explain.
(1 point)
making a decision
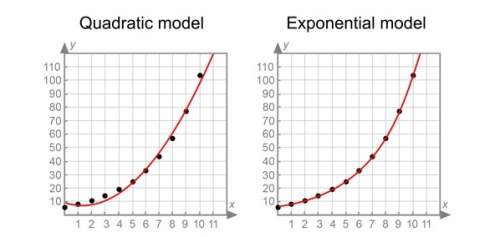
10. these graphs show the scatterplot with the quadratic regression equation and the exponential regression equation.
a) which do you think is a better fit? why? (2 points: 1 point for choice, 1 point for explanation)
b) how does your answer to part (a) compare with your guess about the best model in question 1? was your initial choice correct? (1 point)
analyze your results
11. the video says there were an estimated 10 billion rabbits in australia after 70 years.
a) how does your predicted number of rabbits for the hypothetical population compare with the actual rabbit population in australia in year 70? (1 point)
b) why do you think the rabbit population in australia can grow so large? (1 point)
c) what are some factors that might prevent a rabbit population from growing infinitely large? (1 point)
prompt
rabbits are cute, aren't they? [an image of a rabbit appears.] but they can have lots of cute babies, and it's not long before the babies start having babies . .
[a green image of australia appears.]
in 1859, an australian had 24 wild rabbits shipped to the land down under. [small rabbits begin to pop up on the image of australia and cover it entirely.] within 70 years, there were an estimated 10 billion rabbits in australia. that's billion . . with a b. it's an ecological disaster they're still dealing with.
so, how do we model growth like this mathematically? here's some hypothetical data that grow a lot like the australian rabbit population did. [a table showing the population of rabbits per year is shown]. the rabbit population is getting larger and larger, but is this growth linear? or would a different model work better?

Answers: 1
Another question on Mathematics
Mathematics, 21.06.2019 16:20
Browning labs is testing a new growth inhibitor for a certain type of bacteria. the bacteria naturally grows exponentially each hour at a rate of 6.2%. the researchers know that the inhibitor will make the growth rate of the bacteria less than or equal to its natural growth rate. the sample currently contains 100 bacteria.the container holding the sample can hold only 300 bacteria, after which the sample will no longer grow. however, the researchers are increasing the size of the container at a constant rate allowing the container to hold 100 more bacteria each hour. they would like to determine the possible number of bacteria in the container over time.create a system of inequalities to model the situation above, and use it to determine how many of the solutions are viable.
Answers: 1
Mathematics, 21.06.2019 19:20
Part a: sam rented a boat at $225 for 2 days. if he rents the same boat for 5 days, he has to pay a total rent of $480. write an equation in the standard form to represent the total rent (y) that sam has to pay for renting the boat for x days. (4 points)
Answers: 1
Mathematics, 21.06.2019 23:00
The sum of 5consecutive even numbers is 100. what is the first number in this sequence?
Answers: 1
Mathematics, 22.06.2019 00:00
A6 ounce bottle of dressing costs $1.56 a 14 ounce bottle costs $3.36 a 20 ounce bottle costs $5.60 which has the lowest cost per ounce
Answers: 1
You know the right answer?
Questions


Health, 13.07.2019 16:00


World Languages, 13.07.2019 16:00

Business, 13.07.2019 16:00

Advanced Placement (AP), 13.07.2019 16:00

English, 13.07.2019 16:00
English, 13.07.2019 16:00
English, 13.07.2019 16:00
Mathematics, 13.07.2019 16:00

English, 13.07.2019 16:00
Mathematics, 13.07.2019 16:00
History, 13.07.2019 16:00
Social Studies, 13.07.2019 16:00

Computers and Technology, 13.07.2019 16:00
Mathematics, 13.07.2019 16:00
Mathematics, 13.07.2019 16:00


