
Mathematics, 23.07.2019 13:30 CarQuestionl506
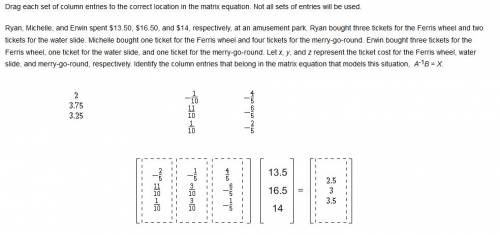
Ryan, michelle, and erwin spent $13.50, $16.50, and $14, respectively, at an amusement park. ryan bought three tickets for the ferris wheel and two tickets for the water slide. michelle bought one ticket for the ferris wheel and four tickets for the merry-go-round. erwin bought three tickets for the ferris wheel, one ticket for the water slide, and one ticket for the merry-go-round. let x, y, and z represent the ticket cost for the ferris wheel, water slide, and merry-go-round, respectively. identify the column entries that belong in the matrix equation that models this situation, a-1b = x.

Answers: 1
![\left[\begin{array}{ccc}3&2&0\\1&0&4\\3&1&1\end{array}\right]*\left[\begin{array}{ccc}x\\y\\z\end{array}\right]=\left[\begin{array}{ccc}13.50\\16.50\\14.00\end{array}\right]](/tpl/images/0974/7857/7e55d.png)
![A^{-1}= \left[\begin{array}{ccc}-\frac{2}{5}&-\frac{1}{5}&\frac{4}{5}\\ \frac{11}{10}&\frac{3}{10}&-\frac{6}{5}\\\frac{1}{10}&\frac{3}{10}&-\frac{1}{5}\end{array}\right]](/tpl/images/0974/7857/95784.png)
Another question on Mathematics
Mathematics, 22.06.2019 05:00
On the blueprint of a house, 42 millimeters represents 8 meters. the actual lehenth of the living room is 5 meters. what is the length on the blueprint
Answers: 3
Mathematics, 22.06.2019 08:00
The following data table represents the total cost of a monthly cell phone bill as a function of the number of minutes that the phone is used each month. minutes 500 750 1,000 1,250
Answers: 1
Mathematics, 22.06.2019 09:30
What are the increasing and decreasing intervals of the function f(x)= (3/x-5)+4 once graphed?
Answers: 1
Mathematics, 22.06.2019 11:00
The following table shows the number of hours some students of a class listen to music each day: student a b c d e f g h i j k l m n o hours 6.5 1 2.5 2.5 4 1 0.5 4.5 5 1 1 2 1.5 1.5 2 which histogram best represents the data? histogram plots number of hours spent listening to music daily on x axis and number of students on y axis. height of the bar in the x interval 0 to 2 is 11, height of the bar in the x interval 2 to 4 is 3 and the height of the bar in the x interval 4 to 6 is 1. histogram plots number of hours spent listening to music daily on x axis and number of students on y axis. height of the bar in the x interval 0 to 3 is 10, height of the bar in the x interval 3 to 6 is 2 and the height of the bar in the x interval 6 to 9 is 1. histogram plots number of hours spent listening to music daily on x axis and number of students on y axis. height of the bar in the x interval 0 to 3 is 11, height of the bar in the x interval 3 to 6 is 3 and the height of the bar in the x interval 6 to 9 is 1. histogram plots number of hours spent listening to music daily on x axis and number of students on y axis. height of the bar in the x interval 0 to 2 is 10, height of the bar in the x interval 2 to 4 is 2 and the height of the bar in the x interval 4 to 6 is 1.
Answers: 1
You know the right answer?
Ryan, michelle, and erwin spent $13.50, $16.50, and $14, respectively, at an amusement park. ryan bo...
Questions

Spanish, 14.05.2021 14:00

Social Studies, 14.05.2021 14:00

English, 14.05.2021 14:00
English, 14.05.2021 14:00
English, 14.05.2021 14:00
Mathematics, 14.05.2021 14:00
Mathematics, 14.05.2021 14:00


Biology, 14.05.2021 14:00
English, 14.05.2021 14:00

Health, 14.05.2021 14:00
Mathematics, 14.05.2021 14:00


