
Mathematics, 22.07.2019 09:00 chaosdamax8295
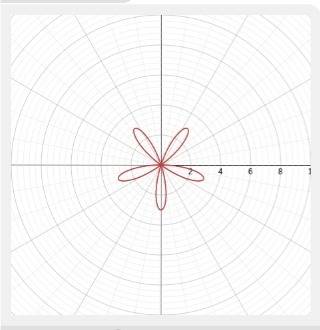
Draw a graph of the rose curve. r = -3 sin 5θ, 0 ≤ θ ≤ 2π

Answers: 1
Another question on Mathematics
Mathematics, 22.06.2019 00:30
Will mark brainliest for correct answer! i have been on this problem for an hour and can't find the answer. i'm begging here! incase you cant read the instructions in the picture because of too much or too little lighting: note: enter your answer and show all the steps that you use to solve this problem in the space provided.write a list of steps that are needed to find the measure of b. provide all steps as clear as possible, !
Answers: 1
Mathematics, 22.06.2019 00:30
Aline has a slope of negative 1/4 the past two points -5/4 and 1 what is the equation of the line
Answers: 2
Mathematics, 22.06.2019 02:00
Ineed on the last 8 questions for this homework i’m trying to get all this done by tuesday when i got to my level 5 teacher if i have passed my tabe
Answers: 1
Mathematics, 22.06.2019 03:00
Describe how the presence of possible outliers might be identified on the following. (a) histograms gap between the first bar and the rest of bars or between the last bar and the rest of bars large group of bars to the left or right of a gap higher center bar than surrounding bars gap around the center of the histogram higher far left or right bar than surrounding bars (b) dotplots large gap around the center of the data large gap between data on the far left side or the far right side and the rest of the data large groups of data to the left or right of a gap large group of data in the center of the dotplot large group of data on the left or right of the dotplot (c) stem-and-leaf displays several empty stems in the center of the stem-and-leaf display large group of data in stems on one of the far sides of the stem-and-leaf display large group of data near a gap several empty stems after stem including the lowest values or before stem including the highest values large group of data in the center stems (d) box-and-whisker plots data within the fences placed at q1 â’ 1.5(iqr) and at q3 + 1.5(iqr) data beyond the fences placed at q1 â’ 2(iqr) and at q3 + 2(iqr) data within the fences placed at q1 â’ 2(iqr) and at q3 + 2(iqr) data beyond the fences placed at q1 â’ 1.5(iqr) and at q3 + 1.5(iqr) data beyond the fences placed at q1 â’ 1(iqr) and at q3 + 1(iqr)
Answers: 1
You know the right answer?
Draw a graph of the rose curve. r = -3 sin 5θ, 0 ≤ θ ≤ 2π...
Questions

English, 01.09.2019 18:00

Health, 01.09.2019 18:00

History, 01.09.2019 18:00
English, 01.09.2019 18:00

Social Studies, 01.09.2019 18:00

Physics, 01.09.2019 18:00


Biology, 01.09.2019 18:00
Physics, 01.09.2019 18:00

Chemistry, 01.09.2019 18:00
Biology, 01.09.2019 18:00


