
Part 1:
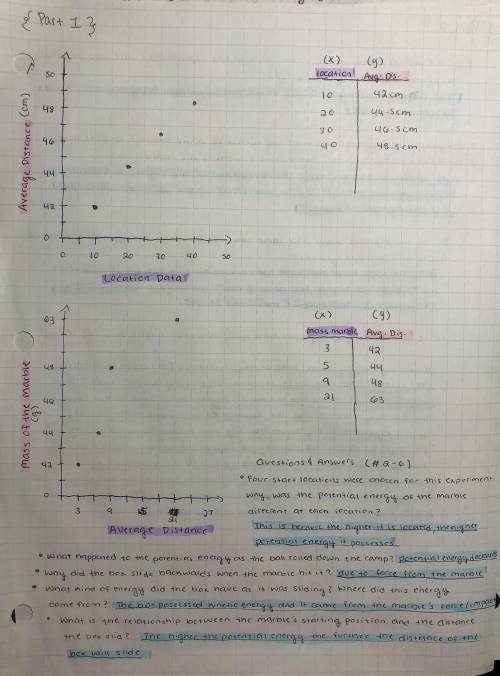
Make a graph of each set of data. For the first set, plot the start location data on the x-axis and the box's average slide distance on the y-axis. For the second set of data, plot the mass of the marble on the x-axis and the average distance the box slides on the y-axis.
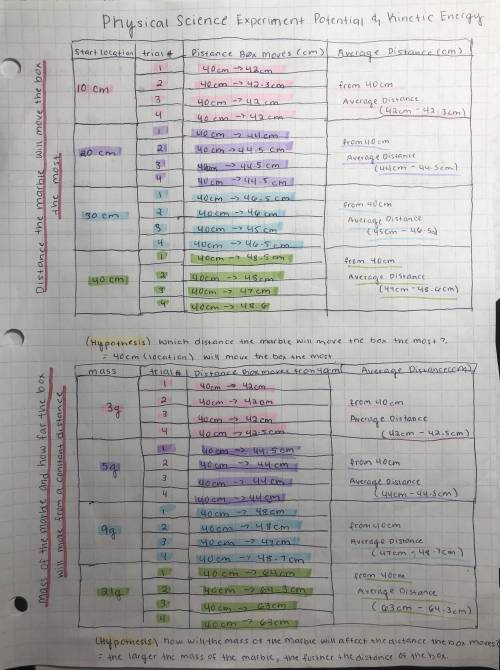
Four start locations were chosen for this experiment. Why was the potential energy of the marble different at each location?
What happened to the potential energy as the ball rolled down the ramp?
Why did the box slide backwards when the marble hit it?
What kind of energy did the box have as it was sliding? Where did this energy come from?
What is the relationship between the marble's starting position and the distance the box slid?
Part 2:
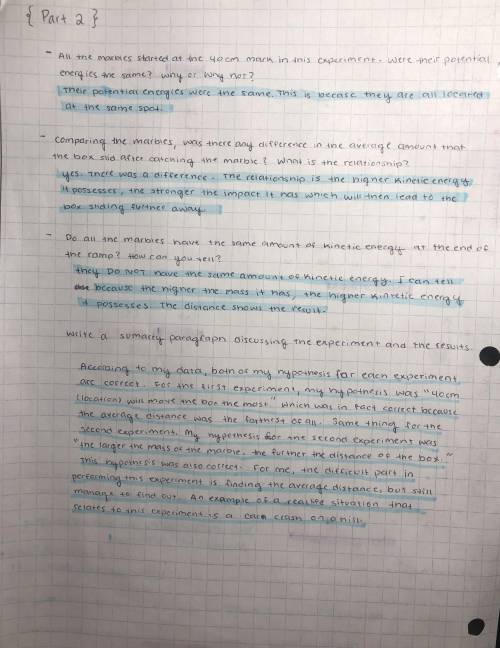
All the marbles started at the 40-cm mark in this experiment. Were their potential energies the same? Why or why not?
Comparing the marbles, was there any difference in the average amount that the box slid after catching the marble? What is the relationship?
Do all of the marbles have the same amount of kinetic energy at the end of the ramp? How can you tell?
Write a summary paragraph discussing this experiment and the results. Use the following questions and topics to help guide the content of your paragraph.
According to your data, was your hypothesis for each experiment correct? (Be sure to refer to your data and graphs when answering this question.)
Summarize the conclusions that you can draw from this experiment. Use the questions above to guide your ideas.
Summarize any difficulties or problems you had in performing the experiment that might have affected the results. Describe how you might change the procedure to avoid these problems.
Give at least one more example from real life where the principles demonstrated in this lab are evident.

Answers: 1
Another question on Physics
Physics, 22.06.2019 06:20
Clothing made of several thin layers of fabric with trapped air in between, often called ski clothing, is commonly used in cold climates because it is light, fashionable, and a very effective thermal insulator. so it is no surprise that such clothing has largely replaced thickand heavy old-fashioned coats. (a) consider a jacket made of five layers of 0.1-mm-thick synthetic fabric (k = 0.13 w/m·°c) with 1.5-mm-thick air space (k = 0.026 w/m·°c) between the layers. assuming the inner surface temperature of the jacket to be 28°c and the surface area to be 1.25 m2, determine the rate of heat loss through the jacket when the temperature of the outdoors is 0°c and the heat transfer coefficient at the outer surface is 25 w/m2·°c. (b) what would your response be if the jacket is made of a single layer of 0.5-mm-thick synthetic fabric? what should be the thickness of a wool fabric (k = 0.035 w/m·°c) if the person is to achieve the same level of thermal comfort wearing a thick wool coat instead of a five-layer ski jacket?
Answers: 1
Physics, 22.06.2019 14:00
Amass attached to a spring is displaced from its equilibrium position by 5cm and released. the system then oscillates in simple harmonic motion with a period of 1s. if that same mass–spring system is displaced from equilibrium by 10cm instead, what will its period be in this case? a mass attached to a spring is displaced from its equilibrium position by and released. the system then oscillates in simple harmonic motion with a period of . if that same mass–spring system is displaced from equilibrium by instead, what will its period be in this case? a) 0.5sb) 2sc) 1sd) 1.4s
Answers: 2
Physics, 22.06.2019 14:00
This is one type of line graph in which the independent variable is time plotted on the x axis and the dependent variable, also numerical, is plotted on the y axis.
Answers: 2
Physics, 22.06.2019 23:30
The photo above shows oil and vinegar in a pitcher. the top make a claim about about the density of the vinegar compared to the density of the oil summarize the evidence to support the claim and explain your reasoning
Answers: 3
You know the right answer?
Part 1:
Make a graph of each set of data. For the first set, plot the start location data on the x-...
Questions


Mathematics, 11.09.2021 03:20
Mathematics, 11.09.2021 03:20


Chemistry, 11.09.2021 03:20
Chemistry, 11.09.2021 03:20
Mathematics, 11.09.2021 03:20
Mathematics, 11.09.2021 03:20
English, 11.09.2021 03:20


