
Physics, 28.09.2020 01:01 carswellml
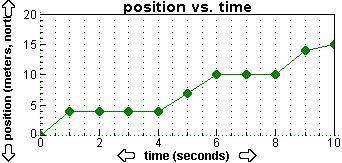
A position versus time graph is shown below.
A Position versus Time graph is shown with y-axis labeled position in meters north up to 20 and x-axis labeled time in seconds up to 10. A line connects points 0, 0 and 1, 4. A horizontal line connects points 1, 4 and 4, 4. A line connects points 4, 4 and 6, 10. A horizontal line connects points 6, 10 and 8, 10. A line connects 8, 10 and 9, 14, and then 10, 15.
Use the graph to determine the average velocity in m/s of the object at the end of 4.0 seconds? (2 points)
a
1 m/s
b
2 m/s
c
4 m/s
d
5 m/s
PLEASE ANSWER QUICK THE TEST IS TIMED

Answers: 1
Another question on Physics
Physics, 22.06.2019 11:00
If a simple machine reduces the strength of a force, what must be increased?
Answers: 3
Physics, 22.06.2019 12:00
Under normal conditions, describe how increasing the temperatures effects the solubility of a typical salt
Answers: 1
Physics, 22.06.2019 16:50
Aresistor with an unknown resistance is connected in parallel to a 9 ω resistor. when both resistors are connected in parallel to an emf source of 21 v, the current through the unknown resistor is measured with an ammeter to be 4 a. what is the resistance of the unknown resistor? answer in units of ω.
Answers: 3
Physics, 22.06.2019 20:40
Abasketball star covers 2.65 m horizontally in a jump to dunk the ball. his motion through space can be modeled precisely as that of a particle at his center of mass. his center of mass is at elevation 1.02 m when he leaves the floor. it reaches a maximum height of 1.90 m above the floor and is at elevation 0.910 m when he touches down again. (a) determine his time of flight (his "hang time"). (b) determine his horizontal velocity at the instant of takeoff. (c) determine his vertical velocity at the instant of takeoff. (d) determine his takeoff angle. (e) for comparison, determine the hang time of a whitetail deer making a jump with center-of-mass elevations yi = 1.20 m, ymax = 2.45 m, and yf = 0.750 m.
Answers: 1
You know the right answer?
A position versus time graph is shown below.
A Position versus Time graph is shown with y-axis labe...
Questions


Health, 04.03.2021 18:10
History, 04.03.2021 18:10
Mathematics, 04.03.2021 18:10

Mathematics, 04.03.2021 18:10
Mathematics, 04.03.2021 18:10


English, 04.03.2021 18:10
Mathematics, 04.03.2021 18:10
Mathematics, 04.03.2021 18:10
Health, 04.03.2021 18:10


