
Physics, 30.10.2020 17:00 janayshas84
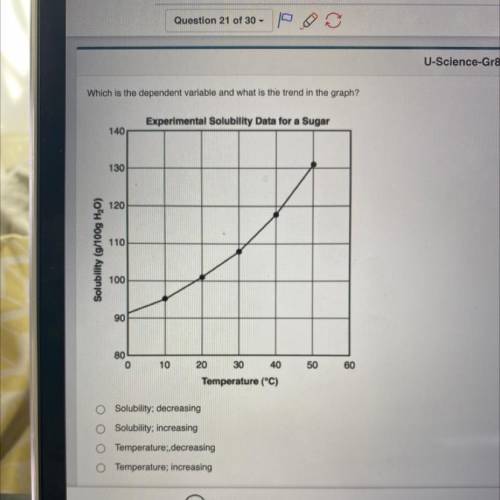
Which is the dependent variable and what is the trend in the graph?
Experimental Solubility Data for a Sugar
140
130
120
110
Solubility (g/100g H,0)
100
90
80
0
10
50
60
20 30 40
Temperature (*C)
Solubility; decreasing
Solubility; increasing
Temperature; decreasing
Temperature; increasing

Answers: 3
Another question on Physics
Physics, 22.06.2019 13:30
Física: un futbolista patea hacia el arco con una velocidad de 15m/ah, calcular: a)el alcance para un ángulo de tiro de 25º, b) el tiempo que el balón permanece en el aire.
Answers: 1
Physics, 22.06.2019 21:00
Ascientist wants to test ways to reduce pollution in lake . what is the bestway of doing this
Answers: 2
Physics, 23.06.2019 01:30
The amount of potential energy possessed by an elevated object is equal to
Answers: 2
Physics, 23.06.2019 13:00
After identifying which method the theory relates better to, use the example of feyerabend to discuss why you think philosophy and science (and, philosophers and scientists) have theories and ideas that blend into one another. how are these two disciplines related?
Answers: 1
You know the right answer?
Which is the dependent variable and what is the trend in the graph?
Experimental Solubility Data fo...
Questions

History, 17.04.2020 19:58

Mathematics, 17.04.2020 19:58


Mathematics, 17.04.2020 19:58

Mathematics, 17.04.2020 19:58
History, 17.04.2020 19:58


