
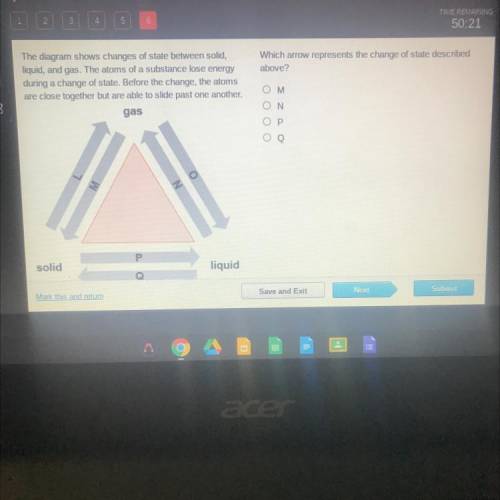
The diagram shows changes of state between solid, liquid, and gas. The atoms of a substance lose energy during a change of state. Before the change, the atoms are close together but are able to slide past one another.
Which arrow represents the change of state described
above?
M
N
P
Q

Answers: 3
Another question on Physics
Physics, 21.06.2019 22:30
Fft review: linspace, fs, fftshift, nfft 1. generate one second of a cosine of w,-10hz sampled at f, = 100hz and assign it to x. define a tt as your time axis 2. take 64 points fft. 3. as you remember, the dft (which the fft implements) computes n samples of s2t where k-0,1,2, n -1. plot the magnitude of this 64-points fft at range 0 to 63, what do you think of this graph? 4â·to get the x-axis into a hz-frequency form, plot this 64-points fft between-50 to 50 (the 100hz sampling rate) and have n-points between them. 5. according to your figure, what frequency is this cosine wave at? 6. remember that the fft is evaluating from 0 to 2ď€. we are used to viewing graphs from-ď€ to ď€. therefore, you need to shift your graph. 7. now according to your shifted graph. what frequency is this at? 8. note that the spikes have long drop-offs? try a 1024-point dft. note that the peak is closer to 10 and the drop-off is quicker. although, now sidelobes are an issue
Answers: 2
Physics, 21.06.2019 23:30
Classify the following soils according to the uscs classification system. provide appropriate uscs designations. a) this sample of well-graded gravel with sand was obtained from a large earthen dam in vancouver, canada. the sample has 73% fine to coarse sub-angular gravel, 25% fine to coarse sub-angular sand and 2% fines. the maximum size of the particles is 75 mm. the coefficient of curvature is 2.7, while the uniformity coefficient is 12.4. b) this dark brown and wet soil with a “strong organic odor” has 100% passing the no. 200 sieve. the liquid limit of the material is 32% when not dried and is 21% when oven-dried. the plastic index is 21% when not dried. c) this sand has 61% predominantly fine sand, 23% silty fines, and 16% fine sub-rounded gravel size. the maximum size is 20 mm. the liquid limit is 33% and the plastic limit is 27%. d) this soil has 74% fine to coarse sub-angular reddish sand and 26% organic and silty dark brown fines. the liquid limit is 37% when not dried and is 26% when oven dried. the plastic index is 6% when not dried.
Answers: 1
Physics, 22.06.2019 17:30
Patricia is trying to compare the average rainfall of new york to that of arizona. a comparison between these two states for the months of july through september would best be measured in
Answers: 3
Physics, 22.06.2019 19:30
Point charges q1=+2.00μc and q2=−2.00μc are placed at adjacent corners of a square for which the length of each side is 1.50 cm . point a is at the center of the square, and point b is at the empty corner closest to q2. take the electric potential to be zero at a distance far from both charges. part a what is the electric potential at point a due to q1 and q2? express your answer with the appropriate units.
Answers: 2
You know the right answer?
The diagram shows changes of state between solid, liquid, and gas. The atoms of a substance lose ene...
Questions

Mathematics, 29.08.2019 10:10
Mathematics, 29.08.2019 10:10
Mathematics, 29.08.2019 10:10

History, 29.08.2019 10:10
Mathematics, 29.08.2019 10:10
Mathematics, 29.08.2019 10:10

Arts, 29.08.2019 10:10
Mathematics, 29.08.2019 10:10

Social Studies, 29.08.2019 10:10

Biology, 29.08.2019 10:10
History, 29.08.2019 10:10
History, 29.08.2019 10:10

Mathematics, 29.08.2019 10:10
Mathematics, 29.08.2019 10:10


