Questions
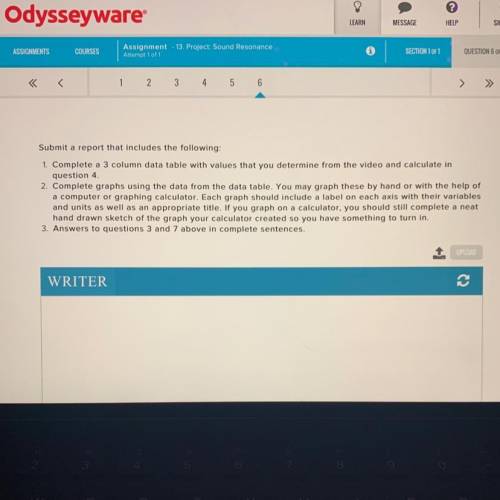
1. Complete the data table using the procedure above and the video provided
2. Grap...

Questions
1. Complete the data table using the procedure above and the video provided
2. Graph the Wavelength v. Frequency using a ruler or computer to assist you. Make sure you label both axis with their
variables and units and give the graph an appropriate title.
3. When you connect the points, what is the shape of the graph? (Hint: The shape is not a parabola)
The relationship between the variables for this shape graph is inverse. That is, the wavelength is proportional to 11
With this knowledge, you can create a linear graph that represents this relationship. The slope is always a constant for
a linear graph and here it will represent something in the lab that was constant
4. Create a third column on your data table, like in the picture, called 1/Frequency with units of seconds. Complete the
third column of the data table by dividing 1 by each of the frequencies in the second column. In other words, if the
first frequency is 512 Hz, then the first 1/f is 1/512 which is 0.0019 S
5. Create a new graph of Wavelength v. 1 Frequency
6. Draw a best fit line through the data points of your new graph, and determine the slope of the line
This process that you just completed is called linearizing a graph. This process allows you to use the relationship
between the variables to The slope of the line is ay, and the units for that will be niseunts or m/s. The slope of your
AX
runun
graph will approximately be the speed of the sound wave in the tube of the experiment. This is commonly taken to be
about 343 m/s, but the exact value depends on the precise temperature in the room at the time the experiment took
place. To calculate the exact value for the speed of sound, use the temperature given at the beginning of the video
and the following equation: Vsound = 331 m/s + 0.6(TC)
7. How close was your result from the slope of your graph to the calculation of the actual value for the speed of sound
in m/s? Give 2 examples of errors that may have occurred during the lab that could have caused your value to be
different than the value that you determined using the equation.
8. Getting the final equation for this lab will require you to match the general equation for a line, y = mx + b, to the linear
graph. In place of y, you have wavelength. In place of x, you have 1 over the frequency. The slope, m, is the velocity
of the sound wave. The y-intercept is zero. Based on all of that, what is your final equation for this lab.


Answers: 1
Another question on Physics

Physics, 21.06.2019 14:20
The eel has a certain amount of rotational kinetic energy when spinning at 14 spins per second. if it swam in a straight line instead, about how fast would the eel have to swim to have the same amount of kinetic energy as when it is spinning?
Answers: 1

Physics, 22.06.2019 19:30
Emagnitude of the electrical force acting between a +2.4 × 10⁻⁸ c charge and a +1.8 × 10⁻⁶ c charge that are separated by 0.008 m is n, rounded to the tenths place.
Answers: 3

Physics, 22.06.2019 21:50
Which of the following is part of the explanation or description of electromagnetic waves? (select all that apply) a. electrically charged molecules in a medium transfer their energy to nearby electrically charged molecules. b. a changing electric field causes a changing magnetic field. c. magnetic molecules in a medium transfer their energy to nearby magnetic molecules. d. a changing magnetic field causes a changing electric field.
Answers: 3

Physics, 23.06.2019 02:00
Which of the following are molecules? a. al b. ag c. mgcl2 d. nacl e. c3h8
Answers: 1
You know the right answer?
Questions

Chemistry, 21.12.2019 19:31


Mathematics, 21.12.2019 19:31

History, 21.12.2019 19:31


Mathematics, 21.12.2019 19:31


Social Studies, 21.12.2019 19:31


Mathematics, 21.12.2019 19:31

English, 21.12.2019 19:31


Mathematics, 21.12.2019 19:31


World Languages, 21.12.2019 19:31


