The following graph shows how density temperature, and salinity of seawater are
,
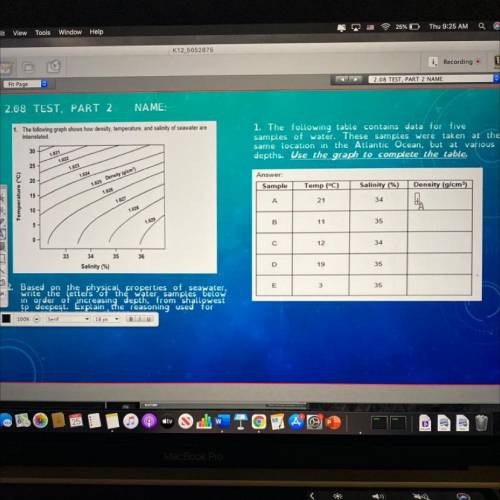
Interrelate...

The following graph shows how density temperature, and salinity of seawater are
,
Interrelated
1. The following table contains data for five
samples of water. These samples were taken at the
same location in the Atlantic Ocean, but at various
depths. Use the graph to complete the table.
30
1.021
1.022
25
1.023
1024
20
Answer
Sample
1.025 Density is om
Temp (°C)
Salinity (%)
Density (g/cm)
1.026
15
1 027
A
21
34
10
1.020
B
11
35
5
0
с
12
34
33
35
36
34
Salinity (%)
D
19
35
E
3
35
Based on the physical properties of seawater,
write the letters of the water samples below
in order of increasing depth, from shallowest
to deepest. Explain the reasoning used for
the sample order chosen.

Answers: 1
Another question on Physics
Physics, 22.06.2019 09:30
Suppose you increase your walking speed from 7 m/s to 13 m/s in a period of 2 s. what is your acceleration?
Answers: 2
Physics, 22.06.2019 09:50
If an athlete runs once around a track, back to the starting line, her average velocity is zero. true or false?
Answers: 3
Physics, 22.06.2019 10:20
Assume that a person skiing high in the mountains at an altitude of h = 15100 ft takes in the same volume of air with each breath as she does while walking at sea level. determine the ratio of the mass of oxygen inhaled for each breath at this high altitude compared to that at sea level. assume that the air composition (i.e. % of air that is oxygen) is the same at sea level as it is at 15100 ft.
Answers: 2
You know the right answer?
Questions

English, 13.10.2019 10:10

Mathematics, 13.10.2019 10:10
English, 13.10.2019 10:10
Mathematics, 13.10.2019 10:10

History, 13.10.2019 10:10
Mathematics, 13.10.2019 10:10
English, 13.10.2019 10:10
History, 13.10.2019 10:10
English, 13.10.2019 10:10

Mathematics, 13.10.2019 10:10
Mathematics, 13.10.2019 10:10
History, 13.10.2019 10:10

Computers and Technology, 13.10.2019 10:10

Spanish, 13.10.2019 10:10
Mathematics, 13.10.2019 10:10


