
Physics, 10.09.2021 01:00 stephenandvicki
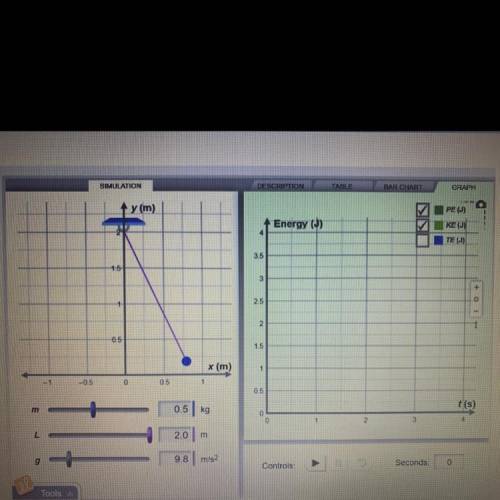
Study the picture of the pendulum simulation and graph above. Think about what will happen when they play button is clicked and the simulation runs. The pendulum will swing back and forth. DRAW ON THE GRAPH SHOWING HOW YOU THINK THE POTENTIAL ENERGY (PE) will change over time.

Answers: 1
Another question on Physics
Physics, 22.06.2019 01:30
Kate is working on a project in her tech education class. she plans to assemble a fan motor. which form of energy does the motor convert most of its electric energy into? a. light energy b. motion energy c. sound energy d. thermal energy
Answers: 1
Physics, 22.06.2019 01:30
Use the frequency histogram to complete the following parts. ​(a) identify the class with the​ greatest, and the class with the​ least, relative frequency. ​(b) estimate the greatest and least relative frequencies. ​(c) describe any patterns with the data. female fibula lengths 30.5 31.5 32.5 33.5 34.5 35.5 36.5 37.5 38.5 39.5 0 0.05 0.1 0.15 0.2 0.25 length (in centimeters) relative frequency a histogram titled "female fibula lengths" has a horizontal axis labeled "length in centimeters" from 30.5 to 39.5 in increments of 1 and a vertical axis labeled "relative frequency" from 0 to 0.25 in increments of 0.05. the histogram contains vertical bars of width 1, where one vertical bar is centered over each of the horizontal axis tick marks. the approximate heights of the vertical bars are listed as follows, where the label is listed first and the approximate height is listed second: 30.5, 0.02; 31.5, 0.04; 32.5, 0.05; 33.5, 0.13; 34.5, 0.22; 35.5, 0.25; 36.5, 0.13; 37.5, 0.06; 38.5, 0.09; 39.5, 0.01. ​(a) the class with the greatest relative frequency is nothing to nothing centimeters. ​(type integers or decimals. do not round. use ascending​ order.)
Answers: 3
Physics, 22.06.2019 05:50
Give your knowledge of these things in your paper, you will compare and contrast analog and digital signals to determine which is more reliable for encoding and transmitting information. you’ll compare these features: signal shape numerical values for signal measurements amount of data that can be transmitted energy requirements privacy and security (ability of the signal to be encoded in a secret code) clarity of signal in the space provided, write down what you already know about any of these features. if you’re not sure, write down questions you might have about the features.
Answers: 3
You know the right answer?
Study the picture of the pendulum simulation and graph above. Think about what will happen when they...
Questions

English, 11.02.2021 14:00

History, 11.02.2021 14:00

Chemistry, 11.02.2021 14:00


Mathematics, 11.02.2021 14:00

Social Studies, 11.02.2021 14:00

Mathematics, 11.02.2021 14:00
English, 11.02.2021 14:00
English, 11.02.2021 14:00
Mathematics, 11.02.2021 14:00
Mathematics, 11.02.2021 14:00

Mathematics, 11.02.2021 14:00
Mathematics, 11.02.2021 14:00


