
SAT, 26.06.2019 05:30 tiniecisneros28
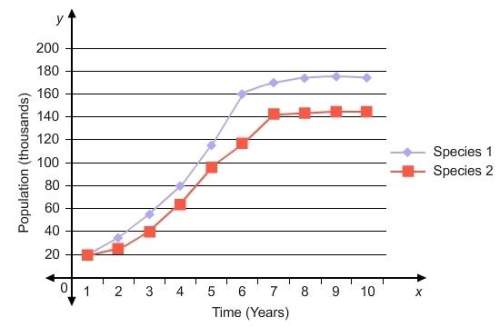
The graph shows the populations of two species over time. which type of symbiotic relationship does the graph represent? a. commensal b. mutualistic c. parasitic d. parent-offspring e. predator-prey
Answers: 1
Another question on SAT
SAT, 23.06.2019 11:40
Approximately workers each year are treated for injuries caused by lifts, jacks, or jack stands. a) 2,000 b) 5,000 c) 10,000 d) 15,000
Answers: 1
SAT, 23.06.2019 23:30
Students who cannot afford to pay the fee for the profile may be granted an automatic: a. scholarhship b. waiver c. fee d. loan
Answers: 2
SAT, 24.06.2019 22:20
The solutions to the inequality y ≤ 2x − 4 are shaded on the graph. which point is a solution? p
Answers: 2
SAT, 26.06.2019 05:30
What kind of interaction is depicted in the image? a. intraspecific, direct b. intraspecific, indirect c. interspecific, direct d. interspecific, indirect e. invasion
Answers: 1
You know the right answer?
The graph shows the populations of two species over time. which type of symbiotic relationship does...
Questions

Mathematics, 13.02.2020 21:43

English, 13.02.2020 21:43
Mathematics, 13.02.2020 21:43

History, 13.02.2020 21:43

Chemistry, 13.02.2020 21:43


History, 13.02.2020 21:43


