Analyze the charts below and answer the question that follows.
Economic Sectors in Austr...

Social Studies, 29.05.2020 02:57 nikki987654
Analyze the charts below and answer the question that follows.
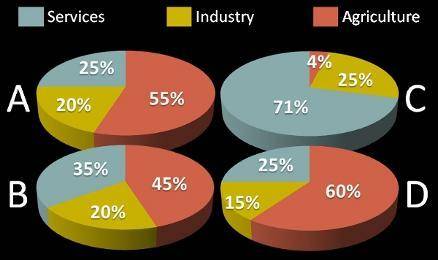
Economic Sectors in Australia (by GDP)
Four pie charts titled Economic Sectors of New Zealand (G D P). Chart A is 25 percent Services, 20 percent Industry, 55 percent Agriculture. Chart B is 35 percent Services, 20 percent Industry, 45 percent Agriculture. Chart C is 71 percent Services, 25 percent Industry, 4 percent Agriculture. Chart D is 25 percent Services, 15 percent Industry, 60 percent Agriculture.
Data courtesy of the CIA World Factbook, 2010
Which of the pie charts above accurately depicts the GDP composition by sector of Australia?
A. Chart A
B. Chart B
C. Chart C
D. Chart D

Answers: 2
Another question on Social Studies
Social Studies, 22.06.2019 00:00
Which of the following is a consequence of the new “24-hour news cycle
Answers: 1
Social Studies, 22.06.2019 08:00
Which civil rights act banned discrimination against any person based on race or color? 14th amendment 15th amendment civil rights act of 1964 voting rights act of 1965
Answers: 2
Social Studies, 22.06.2019 09:00
What role did natural resources play in african politics?
Answers: 1
Social Studies, 22.06.2019 10:00
Which conflict is often referred to as the first "televised war"? a) gulf war b) korean war c) vietnam war d) world war ii
Answers: 2
You know the right answer?
Questions


Mathematics, 21.03.2020 06:57

English, 21.03.2020 06:57
Mathematics, 21.03.2020 06:57
Mathematics, 21.03.2020 06:58
English, 21.03.2020 06:58

Computers and Technology, 21.03.2020 06:59

Mathematics, 21.03.2020 06:59

History, 21.03.2020 06:59


