
Social Studies, 04.12.2020 21:50 gerkera88
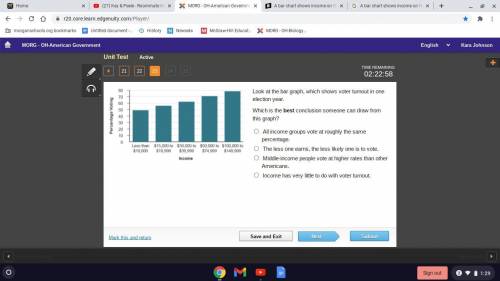
A bar chart shows income on the x axis and percentage voting on the y axis. Less than 10,000 dollars, 49. 15,000 to 19,999 dollars, 56. 30,000 to 39,999 dollars, 62. 50,000 to 74,999, 70. 100,000 to 149,999, 79.
Look at the bar graph, which shows voter turnout in one election year.
Which is the best conclusion someone can draw from this graph?
All income groups vote at roughly the same percentage.
The less one earns, the less likely one is to vote.
Middle-income people vote at higher rates than other Americans.
Income has very little to do with voter turnout.

Answers: 1
Another question on Social Studies
Social Studies, 22.06.2019 01:30
The united states constitution gives the the power to regulate interstate commerce.
Answers: 1
Social Studies, 23.06.2019 05:30
Which argument for religious reform might be convincing to a priest, pope, or king?
Answers: 1
Social Studies, 23.06.2019 05:30
Ineed answers fast how do conflict and cooperation among groups and organizations influence the development of the world? 1. choose two of the following topics: ethnicity and race, working conditions, immigration, military conflict, economic stability. 2. discuss how these two topics impact the development of countries. provide examples. 3. post your response to your teacher.
Answers: 1
You know the right answer?
A bar chart shows income on the x axis and percentage voting on the y axis. Less than 10,000 dollars...
Questions

History, 26.08.2019 16:30

Geography, 26.08.2019 16:30


History, 26.08.2019 16:30
English, 26.08.2019 16:30

Chemistry, 26.08.2019 16:30
Mathematics, 26.08.2019 16:30
Mathematics, 26.08.2019 16:30
Mathematics, 26.08.2019 16:30
Mathematics, 26.08.2019 16:30
Mathematics, 26.08.2019 16:30

Arts, 26.08.2019 16:30


