
Social Studies, 03.02.2021 18:00 Har13526574
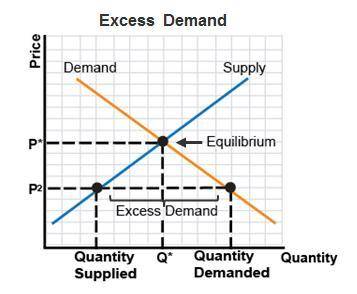
The graph shows excess demand.
A graph titled Excess supply has quantity on the x-axis and price on the y-axis. A line with positive slope represents supply and a line with negative slope represents demand. The lines intersect at the point of equilibrium (p star, Q star). A point on the demand line is (P 2, quantity demanded) and a point on the supply line is (P 2, quantity supplied). Both points are lower than the point of equilibrium. Excess demand is indicated between the 2 points.
Which needs to happen in order to stop disequilibrium from occurring?
Q needs to be coordinated with supply.
Q needs to be coordinated with demand.
The price of goods needs to be increased.
The price of goods needs to be decreased.

Answers: 1
Another question on Social Studies
Social Studies, 23.06.2019 13:30
What idea from enlightenment influenced the founding fathers when writing the declaration of independence?
Answers: 1
Social Studies, 23.06.2019 14:30
Popular sovereignty means that the powers of government belong to and come from the people.
Answers: 1
You know the right answer?
The graph shows excess demand.
A graph titled Excess supply has quantity on the x-axis and price on...
Questions


Mathematics, 23.10.2020 03:01
Mathematics, 23.10.2020 03:01
History, 23.10.2020 03:01

English, 23.10.2020 03:01
Mathematics, 23.10.2020 03:01
Mathematics, 23.10.2020 03:01
History, 23.10.2020 03:01
Mathematics, 23.10.2020 03:01

Mathematics, 23.10.2020 03:01
Mathematics, 23.10.2020 03:01
Mathematics, 23.10.2020 03:01

Business, 23.10.2020 03:01


