Data Analysis
)
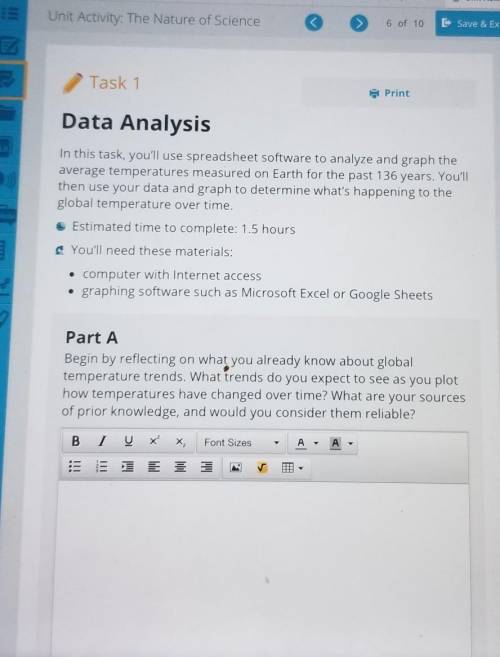
In this task, you'll use spreadsheet software to analyze and graph the
av...

Biology, 25.09.2020 06:01 queenliz855
Data Analysis
)
In this task, you'll use spreadsheet software to analyze and graph the
average temperatures measured on Earth for the past 136 years. You'll
then use your data and graph to determine what's happening to the
global temperature over time.
Estimated time to complete: 1.5 hours
You'll need these materials:
• computer with Internet access
• graphing software such as Microsoft Excel or Google Sheets
Part A
Begin by reflecting on what you already know about global
temperature trends. What trends do you expect to see as you plot
how temperatures have changed over time? What are your sources
of prior knowledge, and would you consider them reliable?


Answers: 2
Another question on Biology

Biology, 22.06.2019 05:00
According to this food web which of the following would be considered primary consumers
Answers: 1


Biology, 22.06.2019 06:20
Restless tectonic plates move (shift) between one and fifteen centimeters per year month day minute
Answers: 2

Biology, 22.06.2019 19:30
If a young male's body is just beginning the process of producing sperm, when is it likely that he would ejaculate mature, viable sperm"
Answers: 3
You know the right answer?
Questions


History, 04.03.2020 03:27


English, 04.03.2020 03:27

History, 04.03.2020 03:27


Mathematics, 04.03.2020 03:27

English, 04.03.2020 03:27

English, 04.03.2020 03:27


