
Biology, 29.10.2020 23:10 mikkelf6158
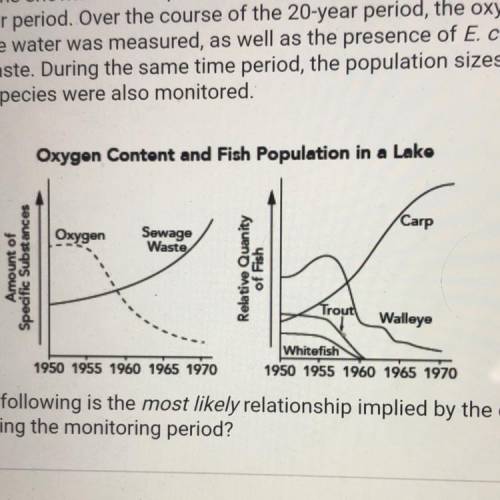
The two graphs shown below represent data collected from the same lake
over a 20-year period. Over the course of the 20-year period, the oxygen
content of the water was measured, as well as the presence of E. coli found
in sewage waste. During the same time period, the population sizes of
varying fish species were also monitored.
Oxygen Content and Fish Population in a Lake
Oxygen
Carp
Sewage
Waste
Amount of
Specific Substances
Relative
Quanity
of Fish
Trout
Walleye
1950 1955 1960 1965 1970
Whitefish
1950 1955 1960 1965 1970
Which of the following is the most likely relationship implied by the data
collected during the monitoring period?
A. The walleye population increases as sewage levels increase.
B. The whitefish population increases as oxygen levels decrease.
O C. The trout population decreases as oxygen levels decrease.
O D. The carp population decreases as sewage levels increase.

Answers: 3
Another question on Biology
Biology, 22.06.2019 06:20
Restless tectonic plates move (shift) between one and fifteen centimeters per year month day minute
Answers: 2
Biology, 22.06.2019 12:00
Which of the following is not associated with invasive species?
Answers: 1
Biology, 22.06.2019 15:00
Agroup of students want to live a healthier life style they decide to use one of these following vegetable oils for cooking apex
Answers: 1
Biology, 22.06.2019 18:40
Hey everybody i need with a biology question. all the gametes of isogamous organisms are genetically identical. true false
Answers: 1
You know the right answer?
The two graphs shown below represent data collected from the same lake
over a 20-year period. Over...
Questions


Mathematics, 16.03.2020 18:59

Chemistry, 16.03.2020 18:59


Business, 16.03.2020 18:59


