
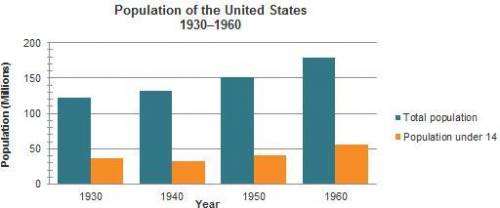
The graph shows US population figures from 1930 to 1960.
What would most likely result fr...

History, 05.05.2020 13:30 AnimeGurlBYah
The graph shows US population figures from 1930 to 1960.
What would most likely result from the population change shown on this graph?
A. More medical services would be needed for the aging population.
B. More schools would need to be built for the younger population.
C. Fewer hospitals would need to be built due to the declining population.
D. Fewer workers would be competing for jobs due to the declining population.

Answers: 1
Another question on History
History, 22.06.2019 00:40
Which group was responsible for determining the borders of african colonies and later countries
Answers: 3
History, 22.06.2019 05:30
How did life change for women african-americans native americans and loyalist after the war in what ways did life remain the same
Answers: 1
You know the right answer?
Questions

History, 30.01.2021 14:00

Mathematics, 30.01.2021 14:00

Mathematics, 30.01.2021 14:00
Mathematics, 30.01.2021 14:00

Geography, 30.01.2021 14:00

Physics, 30.01.2021 14:00
Mathematics, 30.01.2021 14:00
Mathematics, 30.01.2021 14:00
Mathematics, 30.01.2021 14:00
Mathematics, 30.01.2021 14:00
Physics, 30.01.2021 14:00
Mathematics, 30.01.2021 14:00

Health, 30.01.2021 14:00


