The graph shows US energy consumption from 1900 to
2000.
The chart shows a decline in oil co...

History, 30.04.2021 05:10 damienlopezram
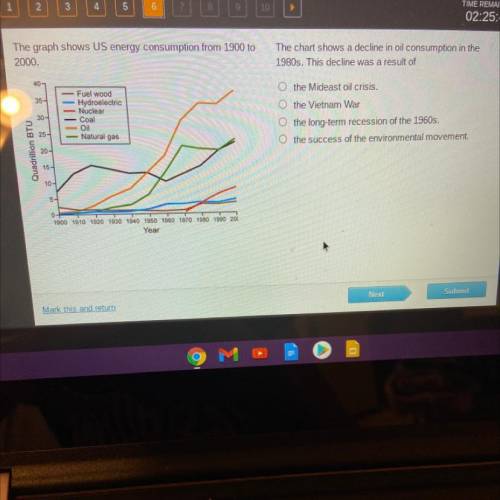
The graph shows US energy consumption from 1900 to
2000.
The chart shows a decline in oil consumption in the
1980s. This decline was a result of
40
O the Mideast oil crisis.
35-
30-
Fuel wood
Hydroelectric
Nuclear
Coal
Oil
Natural gas
O the Vietnam War
o the long-term recession of the 1960s.
O the success of the environmental movement.
25
Quadrillion BTU
10-
5
1900 1910 1920 1930 1940 1950 1960 1970 1980 1990 200
Year

Answers: 3
Another question on History
History, 22.06.2019 02:30
Text: dante's inferno canto iv analyze the setting that dante develops in canto iv. examine how 1) the choices he makes to describe the setting and 2) the characters he places in this setting affect the reader's understanding of the first circle of hell, limbo. be sure to use specific details from the text to support your ideas
Answers: 2
History, 22.06.2019 08:30
According to this map, why did the french do so well at the beginning of the seven years’ war?
Answers: 1
You know the right answer?
Questions


Social Studies, 12.08.2020 06:01

History, 12.08.2020 06:01
Mathematics, 12.08.2020 06:01

Computers and Technology, 12.08.2020 06:01


