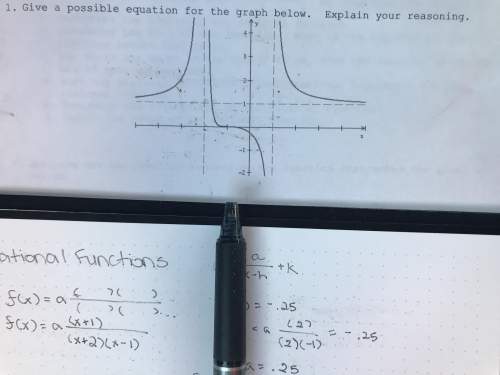
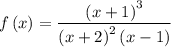
An answer is
Explanation:
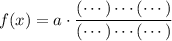
Template:
There is a nonzero horizontal asymptote which is the line y = 1. This means two things: (1) the numerator and degree of the rational function have the same degree, and (2) the ratio of the leading coefficients for the numerator and denominator is 1.
The only x-intercept is at x = -1, and around that x-intercept it looks like a cubic graph, a transformed graph of  ; that is, the zero looks like it has a multiplicty of 3. So we should probably put
  in the numerator.
We want the constant to be a = 1 because the ratio of the leading coefficients for the numerator and denominator is 1. If a was different than 1, then the horizontal asymptote would not be y = 1.
So right now, the function should look something like
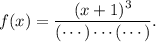
Observe that there are vertical asymptotes at x = -2 and x = 1. So we need the factors 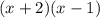 in the denominator. But clearly those two alone is just a degree-2 polynomial.
We want the numerator and denominator to have the same degree. Our numerator already has degree 3; we would therefore want to put an exponent of 2 on one of those factors so that the degree of the denominator is also 3.
A look at how the function behaves near the vertical asympotes gives us a clue.
Observe for x = -2,
as x approaches x = -2 from the left, the function rises up in the positive y-direction, andas x approaches x = -2 from the right, the function rises up.
Observe for x = 1,
as x approaches x = 1 from the left, the function goes down into the negative y-direction, andas x approaches x = 1 from the right, the function rises up into the positive y-direction.
We should probably put the exponent of 2 on the  factor. This should help preserve the function's sign to the left and right of x = -2 since squaring any real number always results in a positive result.
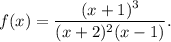
So now the function looks something like
If you look at the graph, we see that  . Sure enough
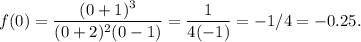
And checking the y-intercept, f(0),
and checking one more point, f(2),
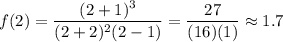
So this function does seem to match up with the graph. You could try more test points to verify.
======
If you're extra paranoid, you can test the general sign of the graph. That is, evaluate f at one point inside each of the key intervals; it should match up with where the graph is. The intervals are divided up by the factors:
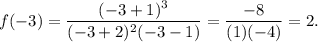
x < -2. Pick a point in here and see if the value is positive, because the graph shows f is positive for all x in this interval. We've already tested this: f(-3) = 2 is positive.-2 < x < -1. Pick a point in here and see if the value is positive, because the graph shows f is positive for all x in this interval.-1 < x < 1. Pick a point here and see if the value is negative, because the graph shows f is negative for all x in this interval. Already tested since f(0) = -0.25 is negative.x > 1. See if f is positive in this interval. Already tested since f(2) = 27/16 is positive.
So we need to see if -2 < x < -1 matches up with the graph. We can pick -1.5 as the test point, then
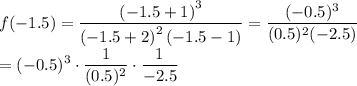
We don't care about the exact value, just the sign of the result.
Since  is negative,
  is positive, and
  is negative, we really have a negative times a positive times a negative. Doing the first two multiplications first, (-) * (+) = (-) so we are left with a negative times a negative, which is positive. Therefore, f(-1.5) is positive.