
Mathematics, 27.01.2020 12:31 gagehamel
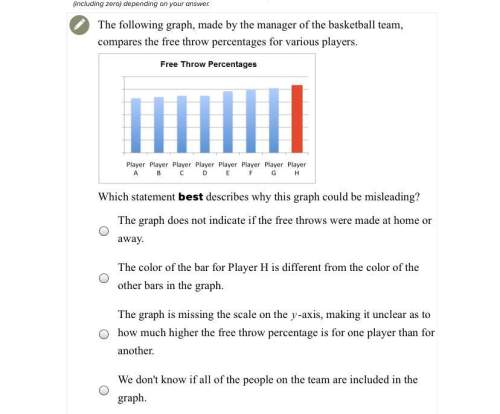
The following graph, made by the manager of the basketball team, compares the free throw percentages for various players.
which statement best describes why this graph could be misleading?
a. the graph does not indicate if the free throws were made at home or away.
b. the color of the bar for player h is different from the color of the other bars in the graph.
c. the graph is missing the scale on the y-axis, making it unclear as to how much higher the free throw percentage is for one player than for another.
d. we don't know if all of the people on the team are included in the graph.

Answers: 2
Another question on Mathematics
Mathematics, 21.06.2019 14:30
Cass decided to sell game programs for the hockey game. the printing cost was over 20 cents per program with a selling price of 50 cents each. cass sold all but 50 of the programs, and made a profit of $65. how many programs were printed? letting p represent the number of programs printed, set up an equation that describes this situation. then solve your equation for p.
Answers: 1
Mathematics, 22.06.2019 02:40
Which method of gathering data will be most effective in learning how diet and fitness choices affect long-term healt
Answers: 1
Mathematics, 22.06.2019 03:00
The formula for finding volume of a cone 1/3pi x r^2h. the volume of a cone is 300 cm^3 and the height of the cone is 10 what is the approximate radius of the cone
Answers: 1
You know the right answer?
The following graph, made by the manager of the basketball team, compares the free throw percentages...
Questions


History, 01.07.2019 01:00
History, 01.07.2019 01:00
History, 01.07.2019 01:00

Biology, 01.07.2019 01:00
History, 01.07.2019 01:00
Mathematics, 01.07.2019 01:00


