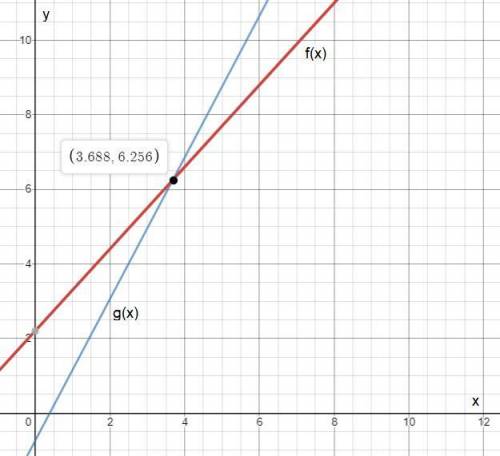
The graph below shows the lines f(x)=1.1x+2.2 and g(x)=1.9x-0.75
. One combination of input an...

Mathematics, 24.04.2020 00:58 chjam265
The graph below shows the lines f(x)=1.1x+2.2 and g(x)=1.9x-0.75
. One combination of input and output values will satisfy both functions. How do you know this? Use the graph to estimate this combination of values. Then create a table of values for each function and use it to justify your answer.

Answers: 3
Another question on Mathematics
Mathematics, 21.06.2019 18:40
That table shows measurements (in invhes$ from cubes with different side lengths. which pairs of variables have a linear relationship? check all that apply
Answers: 3
Mathematics, 21.06.2019 21:30
A(1,1) b(-3,0) c(-4,-1) d(3,-2) drag it to correct position
Answers: 2
Mathematics, 22.06.2019 01:10
Is the response to the survey question "did you smoke in the last week question mark "response to the survey question "did you smoke in the last week? " a discrete random variable, a continuous random variable, or not a random variable?
Answers: 1
Mathematics, 22.06.2019 02:10
Of jk j(–25, 10) k(5, –20). is y- of l, jk a 7: 3 ? –16 –11 –4 –1
Answers: 1
You know the right answer?
Questions


Social Studies, 01.07.2021 15:30

Biology, 01.07.2021 15:30

Social Studies, 01.07.2021 15:30

Computers and Technology, 01.07.2021 15:30


