
Mathematics, 24.04.2020 18:00 cdvazquez727
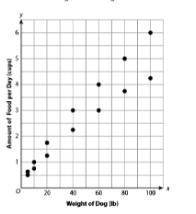
1) The scatter plot below represents the amount of dog food brand recommends based on the weight of the dog. Which best describes the type of association shown in this scatter plot? A. No Association B. Nonlinear association C. Positive Linear Association D. Negative Linear Association.
2) Which pairs of variables would most likely have a positive association?
Choose all that apply.
A. The age of a kitten and its weight
B. Temperature and sales of mittens
C. Temperature and sales of ice cream
D. The height of students and their scores on a test
E. The number of notebooks brought and the total cost
F. The amount of time walking home and the current distance from home
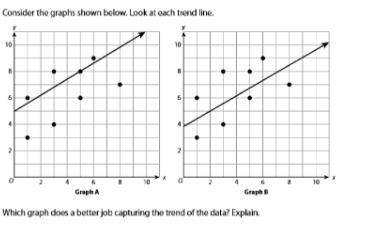
3) Consider the graphs shown below. Look at each trend line.
Which graph does a better job capturing the trend of data? Explain.
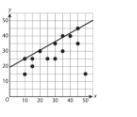
4) Bridget drew the trend line shown in the following scatter plot.
Which statement best explains whether the trend line is a good fit for the data?
A. The trend is not a good fit for the data because there is an outlier
B. The trend line is not good fit for the data because most of the data points are below the trend line
C. The trend line is a good for the data because it passes through two of the data points
D. The trend line is a good fit for the data because the data represent a positive association, and the line has a positive slope.
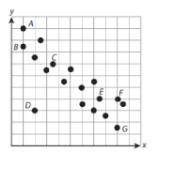
5) Through which pairs of points could a trend line be drawn that represents the data?
Choose all that apply.
A. Points A and F
B. Points B and E
C. Points B and G
D. Points C and E
E. Points D and G
F. Points E and G

Answers: 1
Another question on Mathematics
Mathematics, 21.06.2019 20:30
Tom is the deli manager at a grocery store. he needs to schedule employee to staff the deli department for no more that 260 person-hours per week. tom has one part-time employee who works 20 person-hours per week. each full-time employee works 40 person-hours per week. write and inequality to determine n, the number of full-time employees tom may schedule, so that his employees work on more than 260 person-hours per week. graph the solution set to this inequality.
Answers: 2
Mathematics, 22.06.2019 00:30
Brent paid for 6 avocados with a $20.00 bill. he received $10.40 in change. construct and solve an equation can be used to find the price , of each avocados
Answers: 1
Mathematics, 22.06.2019 01:30
Use the linear combination method to solve the system of equations. explain each step of your solution. if steps are not explained, you will not receive credit for that step. 2 + 9 = −26 −3 − 7 = 13
Answers: 2
You know the right answer?
1) The scatter plot below represents the amount of dog food brand recommends based on the weight of...
Questions

Chemistry, 02.12.2021 21:40


English, 02.12.2021 21:40

Computers and Technology, 02.12.2021 21:40

History, 02.12.2021 21:40

Mathematics, 02.12.2021 21:40
Mathematics, 02.12.2021 21:40

Chemistry, 02.12.2021 21:40

Arts, 02.12.2021 21:40


