14. The circle graph shows the results of an employment survey of 800
people. How many of the...

Mathematics, 29.05.2020 23:01 Aliyahh5673
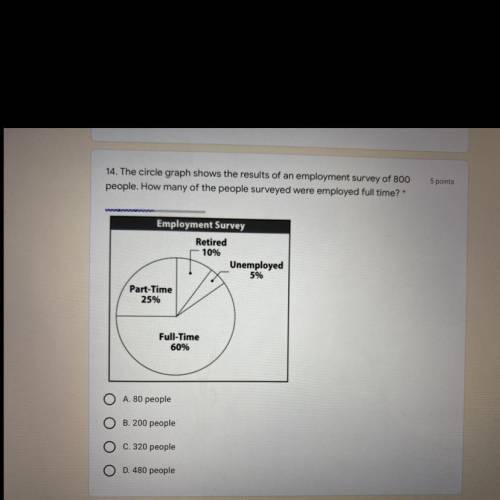
14. The circle graph shows the results of an employment survey of 800
people. How many of the people surveyed were employed full time? *
Employment Survey
Retired
10%
Unemployed
5%
Part-Time
25%
Full-Time
60%
A. 80 people
B. 200 people
C. 320 people
D. 480 people

Answers: 3
Another question on Mathematics
Mathematics, 21.06.2019 16:30
Which choice represents the sample space ,s for this event
Answers: 3
Mathematics, 21.06.2019 17:00
Ataxi company charges $2.25 for the first mile and then $0.20 per mile for each additional mile, or f = $2.25 + $0.20(m - 1) where f is the fare and m is the number of miles. if juan's taxi fare was $6.05, how many miles did he travel in the taxi? if juan's taxi fare was 7.65, how many miles did he travel in taxi
Answers: 1
Mathematics, 21.06.2019 18:00
The base of a triangle exceeds the height by 7 centimeters. if the area is 400 square centimeters, find the length of the base and the height of the triangle.
Answers: 1
You know the right answer?
Questions
Mathematics, 14.07.2019 14:00

History, 14.07.2019 14:00
Mathematics, 14.07.2019 14:00
Mathematics, 14.07.2019 14:00


Biology, 14.07.2019 14:00
Biology, 14.07.2019 14:00
Mathematics, 14.07.2019 14:00
Biology, 14.07.2019 14:00


