
Mathematics, 30.07.2020 18:01 shannydouglas
Drag the tiles to the correct boxes to complete the pairs.
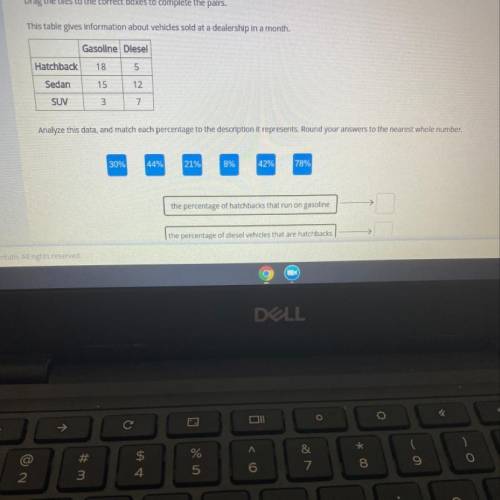
This table gives Information about vehicles sold at a dealership in a month.
Gasoline Diesel
18
5
Hatchback
Sedan
15
12
SUV
3
7
Analyze this data, and match each percentage to the description It represents. Round your answers to the nearest whole number.
30%
44%
21%
8%
42%
78%
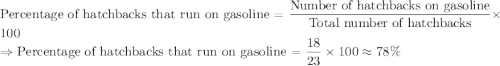
the percentage of hatchbacks that run on gasoline
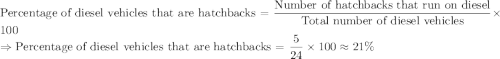
the percentage of diesel vehicles that are hatchbacks
tum. All rights reserved.

Answers: 2
Another question on Mathematics
Mathematics, 21.06.2019 15:20
In exponential growth functions, the base of the exponent must be greater than 1,how would the function change if the base of the exponent were 1? how would the fiction change if the base of the exponent were between 0and 1
Answers: 1
Mathematics, 21.06.2019 15:30
Divide: 1573 ÷ 7 = a) 222 r5 b) 223 r6 c) 224 r5 d) 224 r3
Answers: 2
Mathematics, 21.06.2019 20:30
26) -2(7x) = (-2 • 7) x a. associative property of addition b. associative property of multiplication c. commutative property of multiplication d. commutative property of addition
Answers: 1
You know the right answer?
Drag the tiles to the correct boxes to complete the pairs.
This table gives Information about vehic...
Questions


Mathematics, 15.12.2020 20:00

Health, 15.12.2020 20:00

Advanced Placement (AP), 15.12.2020 20:00

Business, 15.12.2020 20:00
Mathematics, 15.12.2020 20:00
Mathematics, 15.12.2020 20:00

Biology, 15.12.2020 20:00

Social Studies, 15.12.2020 20:00
History, 15.12.2020 20:00


