
Mathematics, 12.10.2020 14:01 nataliahenderso
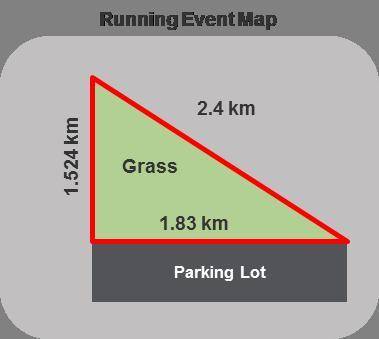
The red lines on the diagram show the layout for a running event. Runners will race around the triangle-shaped grassy area. What is the total length of the race course? what is The total distance in km.

Answers: 3
Another question on Mathematics
Mathematics, 21.06.2019 16:20
Browning labs is testing a new growth inhibitor for a certain type of bacteria. the bacteria naturally grows exponentially each hour at a rate of 6.2%. the researchers know that the inhibitor will make the growth rate of the bacteria less than or equal to its natural growth rate. the sample currently contains 100 bacteria.the container holding the sample can hold only 300 bacteria, after which the sample will no longer grow. however, the researchers are increasing the size of the container at a constant rate allowing the container to hold 100 more bacteria each hour. they would like to determine the possible number of bacteria in the container over time.create a system of inequalities to model the situation above, and use it to determine how many of the solutions are viable.
Answers: 1
Mathematics, 21.06.2019 22:00
Percent increase and decrease. original number: 45 new number: 18
Answers: 1
Mathematics, 21.06.2019 23:00
Acaterpillar eats 1400\%1400% of its birth mass in one day. the caterpillar's birth mass is mm grams. which of the following expressions could represent the amount, in grams, the caterpillar eats in one day? \
Answers: 1
Mathematics, 22.06.2019 02:30
The upcoming championship high school football game is a big deal in your little town. the problem is, it is being played in the next biggest town, which is two hours away! to get as many people as you can to attend the game, you decide to come up with a ride-sharing app, but you want to be sure it will be used before you put all the time in to creating it. you determine that if more than three students share a ride, on average, you will create the app. you conduct simple random sampling of 20 students in a school with a population of 300 students to determine how many students are in each ride-share (carpool) on the way to school every day to get a good idea of who would use the app. the following data are collected: 6 5 5 5 3 2 3 6 2 2 5 4 3 3 4 2 5 3 4 5 construct a 95% confidence interval for the mean number of students who share a ride to school, and interpret the results. part a: state the parameter and check the conditions. part b: construct the confidence interval. be sure to show all your work, including the degrees of freedom, critical value, sample statistics, and an explanation of your process. part c: interpret the meaning of the confidence interval. part d: use your findings to explain whether you should develop the ride-share app for the football game.
Answers: 3
You know the right answer?
The red lines on the diagram show the layout for a running event. Runners will race around the trian...
Questions


Mathematics, 07.09.2020 05:01


Advanced Placement (AP), 07.09.2020 05:01

History, 07.09.2020 05:01


