
Mathematics, 03.11.2020 02:20 steven0448
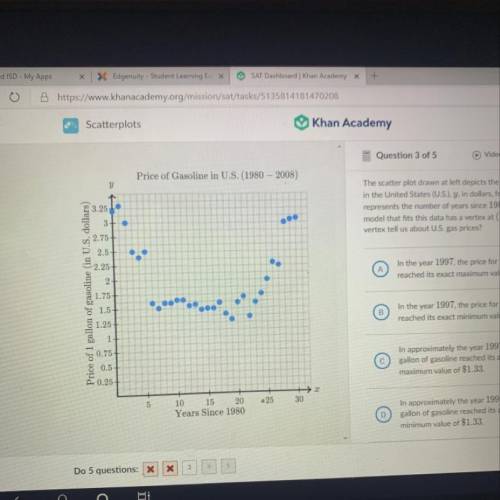
The scatter plot drawn at left depicts the price of 1 gallon of gasoline
in the United States (U. S.), y, in dollars, from 1980 to 2008. If x
represents the number of years since 1980, the graph of a quadratic
model that fits this data has a vertex at (17.24, 1.33). What does the
vertex tell us about U. S. gas prices?
A
In the year 1997, the price for 1 gallon of gasoline
reached its exact maximum value of $1.33.
B
In the year 1997, the price for 1 gallon of gasoline
reached its exact minimum value of $1.33.
In approximately the year 1997, the price for 1
gallon of gasoline reached its approximate
maximum value of $1.33.
D
In approximately the year 1997, the price for 1
gallon of gasoline reached its approximate
minimum value of $1.33.

Answers: 2
Another question on Mathematics
Mathematics, 21.06.2019 17:00
Acylinder and its dimensions are shown. which equation can be used to find v, the volume of the cylinder in cubic centimeters?
Answers: 3
Mathematics, 22.06.2019 01:30
This graph shows a portion of an odd function. use the graph to complete the table of values. x f(x) −2 −3 −4 −6 im sorry i cant get the graph up
Answers: 1
Mathematics, 22.06.2019 02:40
Factor the following polynomial completely 514 + 2013 - 1052 oa. 5121 + 3)( - ) ob. 51%(1 - 3)(1 + 7) oc. 5198 - 3)(x + 7) od 51%(+ 3)(x - 7)
Answers: 1
Mathematics, 22.06.2019 03:00
Select quivalent or not equivalent to indicate whether the expression above is equivalent or not equivalent to the values or expressions in the last column.
Answers: 3
You know the right answer?
The scatter plot drawn at left depicts the price of 1 gallon of gasoline
in the United States (U. S...
Questions


Physics, 17.03.2020 03:12

English, 17.03.2020 03:12


History, 17.03.2020 03:12

Computers and Technology, 17.03.2020 03:12
Biology, 17.03.2020 03:12


