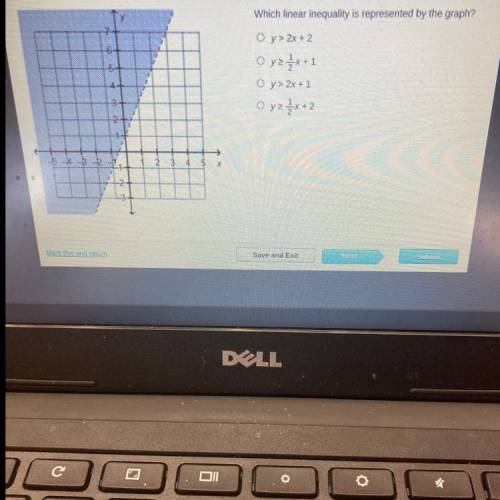
Which linear inequality is represented by the graph?
Many points and timed
...

Mathematics, 17.11.2020 23:30 eelebron0905
Which linear inequality is represented by the graph?
Many points and timed

Answers: 3
Another question on Mathematics
Mathematics, 21.06.2019 21:30
In a test for esp (extrasensory perception), a subject is told that cards only the experimenter can see contain either a star, a circle, a wave, or a square. as the experimenter looks at each of 20 cards in turn, the subject names the shape on the card. a subject who is just guessing has probability 0.25 of guessing correctly on each card. a. the count of correct guesses in 20 cards has a binomial distribution. what are n and p? b. what is the mean number of correct guesses in 20 cards for subjects who are just guessing? c. what is the probability of exactly 5 correct guesses in 20 cards if a subject is just guessing?
Answers: 1
Mathematics, 21.06.2019 23:10
Which graph represents the linear function below? y-4= (4/3)(x-2)
Answers: 2
Mathematics, 22.06.2019 02:00
Ineed on the last 8 questions for this homework i’m trying to get all this done by tuesday when i got to my level 5 teacher if i have passed my tabe
Answers: 1
Mathematics, 22.06.2019 02:20
Find the probability that -0.3203 < = z < = -0.0287 find the probability that -0.5156 < = z < = 1.4215 find the probability that 0.1269 < = z < = 0.6772
Answers: 2
You know the right answer?
Questions

English, 12.04.2021 19:20

Mathematics, 12.04.2021 19:20
Mathematics, 12.04.2021 19:20


Mathematics, 12.04.2021 19:20
Mathematics, 12.04.2021 19:20


