a significant challenge in working with any kind of data is how to present this data to answer questions of interest to human observers. this challenge is especially critical for big data streams because of the volume, variety, or velocity of the data involved. data of large volume has the potential to overwhelm an observers ability to extract meaning from the data. how should the voting data for every us citizen be portrayed to be of interest to political scientists? how should all of the genome data for a species be represented to answer interesting biological questions? how can all of the works of romantic poets be presented for literary analysis? data of highly diverse variety is a challenge because the data forms of data might best be conveyed by different means. integrating different representations in a meaningful way is difficult. for example health-related information contains family history, genomic data, medical test results, descriptions of exercise patterns, records of diet and nutrition, list of stress factors. how can all of this health-related information even for a single individual be displayed for best use by doctors? data with high velocity is changing so rapidly that interesting or significant aspects of the data might be lost. for example, how can stock market data be depicted so that meaningful trends can be seen by a stock analyst? how can data on the movement of vehicles in an urban road system be exhibited so that traffic engineers can determine better ways to avoid traffic jams?
data visualization is often a useful way to present complex data. the adage that “a picture is worth a thousand words” reflects the power of the human visual system. presenting data in a visual form leverages the ability of our visual systems to us see patterns or to detect special cases of interest that are distinctive in some way. finding a good visualization is, of course, not always easy. the picture game “where’s waldo” shows how easy it is to create a visual representation that hides the feature of interest.
there are a rich variety of ways to visualize data in both two and three dimensions. for example, here is a gallerylinks to an external site. of visualization that can be produced by the tools we will be using. developing the knowledge and skills to build intricate and compelling visualizations is a study on its own. however, some basic forms of visualization are very useful for a number of “first step” explorations of big data. these basic forms are:
line graphs: showing how data changes over time (e.g. how the value of a stock changes over the trading days).
histograms: showing the distribution over a range (e.g., how many earthquakes are there in a month in each of the six units on the richter scale).
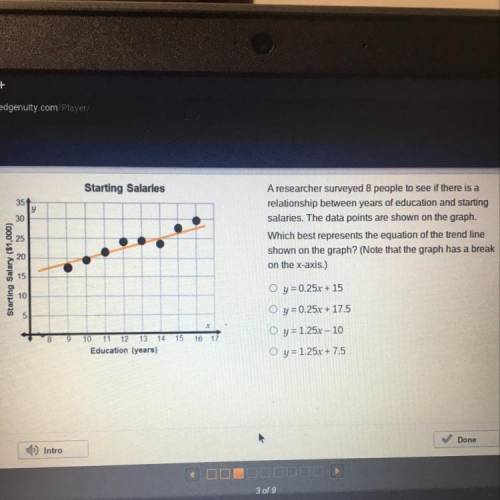
scatter plots: showing the relationship between two different factors (e.g., how the temperature and humidity for a given city are related),
bar charts: showing the comparative values in certain categories (e.g., display the average forecast temperature for new york, ny, blacksburg, va, and seattle,
map plots: showing the distribution over geographic space (e.g., where on the globe have earthquakes in the last month occurred).
you can also think of visualizations that you see every day as other examples of how data is presented: weather maps, hurricane tracks, election maps.
we will be using matplotlib to illustrate visualization of data. matplotlib is widely used and offers the capability to generate many different kinds of visualization in python. we saw examples of its variety of visualization in the matplotlib gallery above. however, this utility comes at a price. matplotlib is complicated. fortunately, matplotlib is designed so that many common cases can be done with minimal or reasonable effort. in addition to matplotlib we will also look at a library for geographical plotting that is built on top of matplotlib.
step-by-step explanation:


