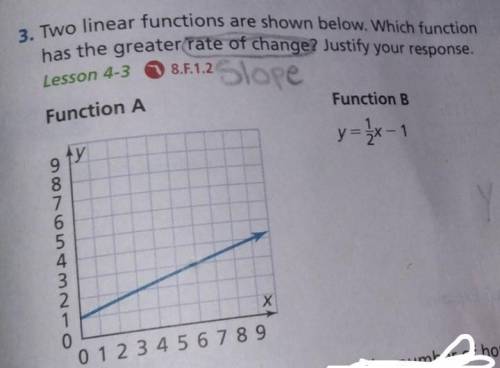
Function B has the greater rate of change.
Step-by-step explanation:
Rate of change is known as the change in y over the change in x.
Function A:
To find the rate of change on a graph, find the change in y and the change in x from one point to another point. The line on the graph goes from point (0, 1) to point (3, 2). This means that every time the value of y goes up by 1, the value of x goes up by 3. So, the rate of change for function A is  .
.
Function B:
The given equation is  . Function B is written in the format y = mx + b, where m is the rate of change. So, the rate of change for function B is
  .
.
Now that we know the rate of change for both functions, we can compare their values and find which one is greater:
is greater than , so the rate of change for function B is greater than the rate of change for function A.