
Mathematics, 03.12.2020 22:20 gabev420
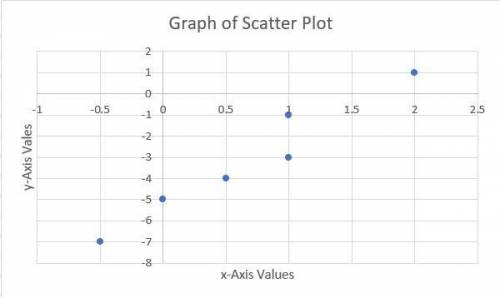
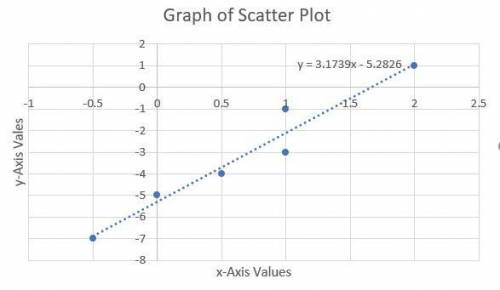
Which equation best models the data shown in the scatter plot?
In the graph of scatter plot, the range of the x axis is minus four to four by increment of one and the range of the y axis is minus seven to one by increment of one. On the x axis minus four, minus two, two, and four are labeled. On the y axis minus six, minus four, and minus two are labeled. On the graph, there are points at (-0.5, -7), (0, -5), (0.5, -4), (1, -3), (1, -1), and (2, 1).
A. y = x − 3
B. y = x − 5
C. y = 3x − 3
D. y = 3x − 5

Answers: 1
Another question on Mathematics
Mathematics, 21.06.2019 22:10
Gravel is being dumped from a conveyor belt at a rate of 25 ft3/min, and its coarseness is such that it forms a pile in the shape of a cone whose base diameter and height are always equal. how fast is the height of the pile increasing when the pile is 14 ft high? (round your answer to two decimal places.) ft/min
Answers: 3
Mathematics, 21.06.2019 22:30
Meghan has created a diagram of her city with her house, school, store, and gym identified. a. how far is it from the gym to the store? b. meghan also wants to walk to get some exercise, rather than going to the gym. she decides to walk along arc ab. how far will she walk? round to 3 decimal places.
Answers: 1
You know the right answer?
Which equation best models the data shown in the scatter plot?
In the graph of scatter plot, the ra...
Questions


Social Studies, 01.03.2021 22:20

Mathematics, 01.03.2021 22:20

Mathematics, 01.03.2021 22:20
English, 01.03.2021 22:20
History, 01.03.2021 22:20
Mathematics, 01.03.2021 22:20


