
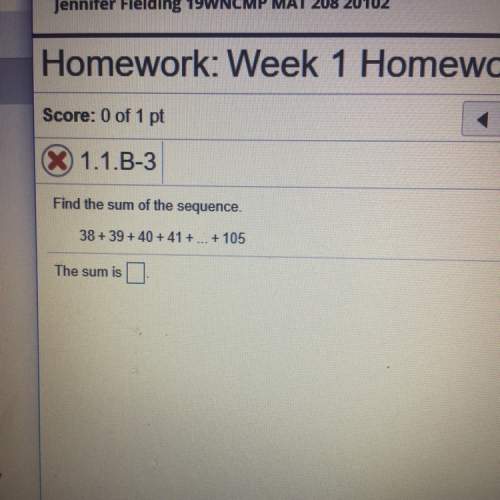
Mathematics, 12.12.2020 16:30 chaseashley24
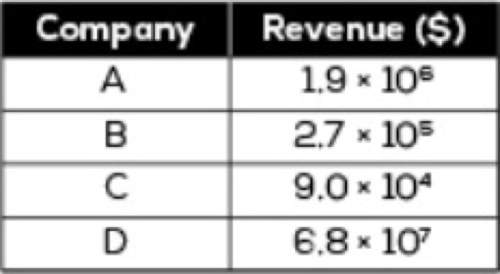
A manufacturer of colored candies states that 13% of the candies in a bag should be brown, 14% yellow, 13% red, 24% blue, 20% orange, and 16% green. A student randomly selected a bag of colored candies. He counted the number of candies of each color and obtained the results shown in the table. Test whether the bag of colored candies follows the distribution stated above at the α=0.05 level of significance.
Brown: 60 | 0.13
Yellow: 64 | 0.14
Red: 52 | 0.13
Blue: 62 | 0.24
Orange: 97 | 0.20
Green: 65 | 0.16
Also, please explain how to get the expected count, since that is throwing me off by a lot and I can't seem to figure it out.

Answers: 1
Another question on Mathematics
Mathematics, 21.06.2019 13:40
What is the correlation coefficient for the data? don't forget to turn the diagnoisticon (in the catalog menu of the calculator). r = answer (round to the nearest thousandth)
Answers: 1
You know the right answer?
A manufacturer of colored candies states that 13% of the candies in a bag should be brown, 14% yello...
Questions


Computers and Technology, 06.11.2019 02:31

Computers and Technology, 06.11.2019 02:31

History, 06.11.2019 02:31

Biology, 06.11.2019 02:31

Physics, 06.11.2019 02:31
Physics, 06.11.2019 02:31
Biology, 06.11.2019 02:31
Biology, 06.11.2019 02:31

Biology, 06.11.2019 02:31
Biology, 06.11.2019 02:31
Physics, 06.11.2019 02:31


