
Mathematics, 08.01.2021 05:30 slrich21
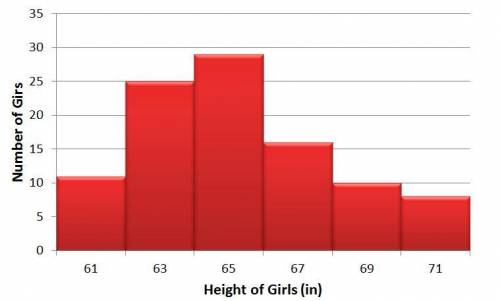
The histogram shows a distribution of girls' heights in inches.
Which statement best describes the distribution?
A.
The data is positively skewed because the majority of the data is clustered to the left of the center.
B.
The data is negatively skewed because the majority of the data is clustered to the left of the center.
C.
The data is positively skewed because the majority of the data is clustered to the right of the center.
D.
The data is negatively skewed because the majority of the data is clustered to the right of the center.

Answers: 1

Another question on Mathematics
Mathematics, 21.06.2019 19:30
Acar started driving from city a to city b, distance between which is 620 miles, at a rate of 60 mph. two hours later a truck left city b and started moving towards city a at a rate of 40 mph. what distance from city a is the point where the truck and the car will meet?
Answers: 1
Mathematics, 21.06.2019 21:30
Joanie wrote a letter that was 1 1/4 pages long. katie wrote a letter that was 3/4 page shorter then joagies letter. how long was katies letter
Answers: 1
Mathematics, 21.06.2019 23:00
Asporting good store is offering 30 percent off of the original price(x) of football cleats. the discount will be reduced by an another $7 before sales tax.
Answers: 1
You know the right answer?
The histogram shows a distribution of girls' heights in inches.
Which statement best describes the...
Questions
Mathematics, 21.10.2020 04:01

Chemistry, 21.10.2020 04:01

Mathematics, 21.10.2020 04:01


Health, 21.10.2020 04:01

Spanish, 21.10.2020 04:01
Social Studies, 21.10.2020 04:01
English, 21.10.2020 04:01
Mathematics, 21.10.2020 04:01
Mathematics, 21.10.2020 04:01

Biology, 21.10.2020 04:01

Mathematics, 21.10.2020 04:01


