
Mathematics, 17.01.2021 04:30 greenbyron88
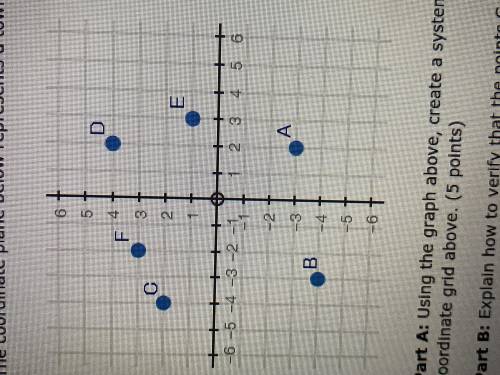
The coordinate plane below represents a town points a through F are farms in the town.
Part A:Using the graph above create a system of inequalities that only contains points C and F in the overlapping shaded regions. Explain how the lines will be graphed and shaded on the cordinate grid above.
Part B: Explain how to verify that the points C and F are solutions to the system of inequalities created in part A
Part C: Chickens can only be raised in the area defined by y < 5x - 3. Explain how you can identify farms in which chickens can be raised.

Answers: 3
Another question on Mathematics
Mathematics, 21.06.2019 15:30
Find the perimeter of the figure shown above. a. 50 cm c. 30 cm b. 64 cm d. 60 cm select the best answer from the choices provided a b c d
Answers: 1
Mathematics, 21.06.2019 17:30
Aplot of land is shaped like a quadrilateral. fences are built on the diagonal to divide the area into 4 sections. what is vi to the nearest tenth? gv = 6.55fv = 5.84vh = 3.27vi = ?
Answers: 1
Mathematics, 21.06.2019 18:30
To determine the number of deer in a forest a forest ranger tags 280 and releases them back
Answers: 3
You know the right answer?
The coordinate plane below represents a town points a through F are farms in the town.
Part A:Using...
Questions


Biology, 05.07.2019 17:20
Biology, 05.07.2019 17:20


SAT, 05.07.2019 17:20

Social Studies, 05.07.2019 17:20


