
Mathematics, 22.01.2021 22:20 jordanfwtm
HELP ASAP
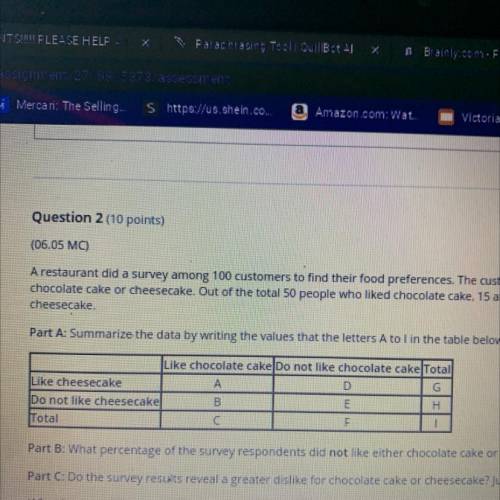
A restaurant did a survey among 100 customers to find their food preferences. The customers were asked about their preferences for
chocolate cake or cheesecake. Out of the total 50 people who liked chocolate cake, 15 also liked cheesecake. There were 25 people who liked
cheesecake
Part A: Summarize the data by writing the values that the letters A to l in the table below represent. (5 points)
Part B: What percentage of the survey respondents did not like either chocolate cake or cheesecake? (3 points)
Part C: Do the survey results reveal a greater dislike for chocolate cake or cheesecake? Justify your answer. (2 points)

Answers: 1

Another question on Mathematics
Mathematics, 21.06.2019 22:20
Line segment eg is partitioned by point f in the ratio 1: 1. point e is at e (0, 4), and point f is at (1, 3). what are the coordinates of point g? (−1, 5) (2, 2) (3, 1) (4, 0)
Answers: 2
Mathematics, 22.06.2019 02:00
Now, martin can reasonably guess that the standard deviation for the entire population of people at the mall during the time of the survey is $1.50. what is the 95% confidence interval about the sample mean? interpret what this means in the context of the situation where 95 people were surveyed and the sample mean is $8. use the information in this resource to construct the confidence interval.
Answers: 3
Mathematics, 22.06.2019 02:30
Suppose you have 10 skittles. 5 green and 5 red. you choose 4 without looking. what is the probability that all 4 skittles will be green?
Answers: 2
You know the right answer?
HELP ASAP
A restaurant did a survey among 100 customers to find their food preferences. The custome...
Questions
Mathematics, 02.09.2021 23:30

Mathematics, 02.09.2021 23:30

History, 02.09.2021 23:30
English, 02.09.2021 23:30

English, 02.09.2021 23:30

Spanish, 02.09.2021 23:30

Mathematics, 02.09.2021 23:30

Arts, 02.09.2021 23:30
Mathematics, 02.09.2021 23:30

Physics, 02.09.2021 23:30


