
Mathematics, 27.01.2021 08:40 makennahudson94
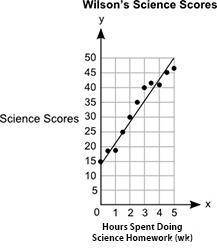
The graph shows Wilson's science scores versus the number of hours spent doing science homework. A graph titled Wilsons Science Scores shows Hours of Practice in a Week on x axis and Science Scores on y axis. The x axis scale is shown from 0 to 5 at increments of 1, and the y axis scale is shown from 0 to 50 at increments of 5.The ordered pairs 0, 15 and 0.5, 18 and 1, 18 and 1.5, 25 and 2, 30 and 2.5, 35 and 3, 40 and 3.5, 43 and 4, 41 and 4.5, 45 and 5, 48 are shown on the graph. A straight line joins the ordered pairs 0, 14.9 and 5, 50. What will most likely be Wilson's approximate science score if he does science homework for 6 hours a week? 33 points 42 points 52 points 55 points

Answers: 3
Another question on Mathematics
Mathematics, 21.06.2019 18:30
Three times the sum of a number and seven is negative thirty-six. what is the number?
Answers: 2
Mathematics, 21.06.2019 20:00
If the simple annual interest rate on a loan is 6, what is the interest rate in percentage per month?
Answers: 1
Mathematics, 22.06.2019 00:10
Which of the following expressions cannot be simplified to x – 2?
Answers: 1
Mathematics, 22.06.2019 01:00
Which angle has the same measure as the dehedral angle formed by the orange face and the purple rectangle
Answers: 1
You know the right answer?
The graph shows Wilson's science scores versus the number of hours spent doing science homework. A g...
Questions
Mathematics, 16.06.2020 02:57


Mathematics, 16.06.2020 02:57

Biology, 16.06.2020 02:57


Chemistry, 16.06.2020 02:57

Mathematics, 16.06.2020 02:57


