
Mathematics, 29.01.2021 21:30 MickeyAppleX
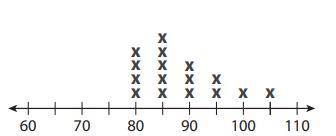
The dot plot shown represents the number of students enrolled in each of the 16 courses at a community college. A new course has started and has 65 enrolled students. Select all of the following statements that are NOT true.
a
The median class size does not change.
b
The mean is lower.
c
The range increases by 40.
d
The mode increases.

Answers: 1
Another question on Mathematics
Mathematics, 21.06.2019 18:00
Janie has $3. she earns $1.20 for each chore she does and can do fractions of chores. she wants to earn enough money to buy a cd for $13.50. write an inequality to determine the number of chores, c, janie could do to have enough money to buy the cd.
Answers: 2
Mathematics, 21.06.2019 18:30
The median of a data set is the measure of center that is found by adding the data values and dividing the total by the number of data values that is the value that occurs with the greatest frequency that is the value midway between the maximum and minimum values in the original data set that is the middle value when the original data values are arranged in order of increasing (or decreasing) magnitude
Answers: 3
You know the right answer?
The dot plot shown represents the number of students enrolled in each of the 16 courses at a communi...
Questions

Mathematics, 04.10.2019 19:30


Social Studies, 04.10.2019 19:30

Mathematics, 04.10.2019 19:30
Social Studies, 04.10.2019 19:30
Mathematics, 04.10.2019 19:30
Mathematics, 04.10.2019 19:30
Mathematics, 04.10.2019 19:30

Computers and Technology, 04.10.2019 19:30

History, 04.10.2019 19:30
Mathematics, 04.10.2019 19:30
Mathematics, 04.10.2019 19:30
Mathematics, 04.10.2019 19:30


