Can someone do it quickly since it’s a timed test
Paper 2
The scatter diagram shows the score...

Mathematics, 12.02.2021 14:10 spycn5069
Can someone do it quickly since it’s a timed test
Paper 2
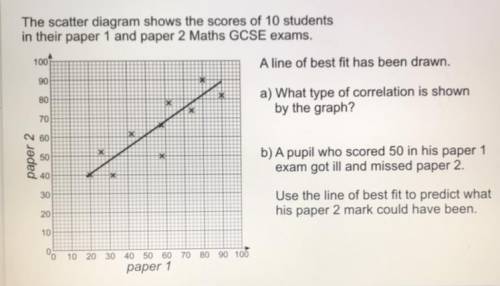
The scatter diagram shows the scores of 10 students
in their paper 1 and paper 2 Maths GCSE exams.
1001
A line of best fit has been drawn.
90
a) What type of correlation is shown
by the graph?
80
A
70
60
paper 2
50
40
b) A pupil who scored 50 in his paper 1
exam got ill and missed paper 2.
Use the line of best fit to predict what
his paper 2 mark could have been
30
20
10
10 20 30 40 50 60 70 80 90 100
paper 1

Answers: 3
Another question on Mathematics
Mathematics, 21.06.2019 16:00
What are the measures of ∠a, ∠b, ∠c and ∠d? explain how to find each of the angle measure.
Answers: 1
Mathematics, 21.06.2019 20:00
Solve for x and y a x= 13.3 y= 16.7 b x= 23.3 y= 12.5 c x= 7.5 y= 16.7 d x=7.5 y= 12.5
Answers: 1
Mathematics, 21.06.2019 22:00
Asales representative from a local radio station is trying to convince the owner of a small fitness club to advertise on her station. the representative says that if the owner begins advertising on the station today, the club's total number of members will grow exponentially each month. she uses the given expression to model the number of club members, in hundreds, after advertising for t months.
Answers: 2
You know the right answer?
Questions


English, 04.08.2022 20:50
Mathematics, 04.08.2022 22:50
Mathematics, 04.08.2022 23:40
Chemistry, 05.08.2022 01:00

Business, 05.08.2022 01:10
Mathematics, 05.08.2022 01:20

Mathematics, 05.08.2022 07:00

Mathematics, 05.08.2022 14:00
Mathematics, 05.08.2022 14:10
Mathematics, 05.08.2022 17:20


