
Mathematics, 12.03.2021 06:50 eayoungin
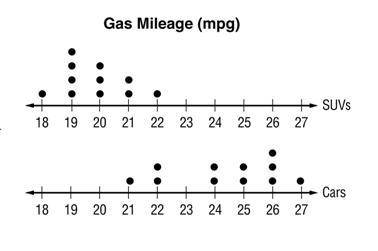
Compare the centers and variations of the two populations. Round to the nearest tenth if necessary. Write an inference you can draw about the two populations.
GAS MILEAGE The double dot plot shows the gas mileage, in miles per gallon, for several cars and SUVs.
a. The median for the SUV data is 25 with a variation of 4. The median for the car data is 20 with a variation of 2. SUVS have a greater gas mileage with a greater variation.
b. The median for the SUV data is 28 with a variation of 2. The median for the car data is 25 with a variation of 4. SUVS have a greater gas mileage with a greater variation.
c. The median for the SUV data is 20 with a variation of 2. The median for the car data is 25 with a variation of 4. Cars have a greater gas mileage with a greater variation.
d. The median for the SUV data is 32 with a variation of 2. The median for the car data is 25 with a variation of 4. Cars have a greater gas mileage with a less variation.

Answers: 1
Another question on Mathematics
Mathematics, 21.06.2019 16:30
Which elements in the set below are integers? 12, –3⁄4,√ 25 , –7, √ 5 , 14⁄7, 9 a. 12, √ 25 , –7, 9 b. 12, √ 25 , –7, 14⁄7, 9 c. –3⁄4, 25 , √ 5 ,14⁄7 d. 12, –7, 9
Answers: 2
Mathematics, 21.06.2019 18:00
Based on the graph, what is the initial value of the linear relationship? a coordinate plane is shown. a line passes through the y-axis at -2 and the x-axis at 3.
Answers: 3
Mathematics, 21.06.2019 18:30
School has 204 sixth grade students. if the sixth grade is 30% of the total school, how many students are in the middle school?
Answers: 2
You know the right answer?
Compare the centers and variations of the two populations. Round to the nearest tenth if necessary....
Questions

Mathematics, 12.11.2020 22:30
Mathematics, 12.11.2020 22:30
Mathematics, 12.11.2020 22:30

English, 12.11.2020 22:30
Mathematics, 12.11.2020 22:30
SAT, 12.11.2020 22:30
Mathematics, 12.11.2020 22:30

History, 12.11.2020 22:30

Mathematics, 12.11.2020 22:30

Biology, 12.11.2020 22:30
History, 12.11.2020 22:30


