
Mathematics, 24.03.2021 22:50 dairysoto9171
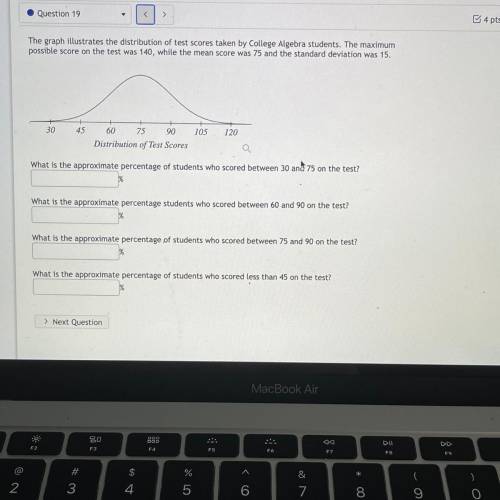
The graph illustrates the distribution of test scores taken by College Algebra students. The maximum
possible score on the test was 140, while the mean score was 75 and the standard deviation was 15.
30
45
105
120
60 75 90
Distribution of Test Scores
Q
What is the approximate percentage of students who scored between 30 and 75 on the test?
What is the approximate percentage students who scored between 60 and 90 on the test?
What is the approximate percentage of students who scored between 75 and 90 on the test?
What is the approximate percentage of students who scored less than 45 on the test?

Answers: 3
Another question on Mathematics
Mathematics, 21.06.2019 13:30
One expression below in undefined, and the other expression has a well defined value. which expression is undefined and explain why it has no value. which expression is defined? what is the value of that expression and how do you know? what is a different expression using a trig inverse function that is also undefined?
Answers: 1
Mathematics, 21.06.2019 17:30
Any is very appreciated! (picture is provided below)not sure how to do this at all won't lie
Answers: 1
Mathematics, 21.06.2019 20:00
Can someone factor this fully? my friend and i have two different answers and i would like to know if either of them is right. you in advance. a^2 - b^2 + 25 + 10a
Answers: 1
Mathematics, 21.06.2019 23:00
Edger needs 6 cookies and 2 brownies for every 4 plates how many cookies and brownies does he need for 10 plates
Answers: 1
You know the right answer?
The graph illustrates the distribution of test scores taken by College Algebra students. The maximum...
Questions
Mathematics, 26.02.2021 04:40

Advanced Placement (AP), 26.02.2021 04:40

History, 26.02.2021 04:40

History, 26.02.2021 04:40
Mathematics, 26.02.2021 04:40
Mathematics, 26.02.2021 04:40


Chemistry, 26.02.2021 04:40
Mathematics, 26.02.2021 04:40


