

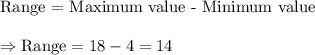
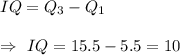
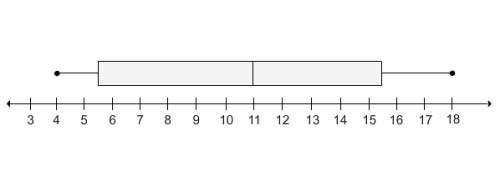
Find the range and the interquartile range of the data set represented by the box plot.
...

Mathematics, 27.12.2019 17:31 NerdyJason
Find the range and the interquartile range of the data set represented by the box plot.

Answers: 2
Another question on Mathematics
Mathematics, 21.06.2019 14:00
In factoring by grouping, what would you have for step 3 for the following? step 1: x^3 +5x^2 +4x+20 step 2: x^2 (x+5)+4(x+5) step 3: ?
Answers: 2
Mathematics, 21.06.2019 20:30
Solve each quadratic equation by factoring and using the zero product property. n^2 - 49 = 0
Answers: 2
Mathematics, 21.06.2019 21:30
Julie goes to the sports store and spends $40.50 before tax. she buys a pair of shorts for $21.75 and 3 pairs of socks that each cost the same amount. how much does each pair of socks cost? $$
Answers: 1
You know the right answer?
Questions

Social Studies, 14.09.2021 14:00
Mathematics, 14.09.2021 14:00
Mathematics, 14.09.2021 14:00

Biology, 14.09.2021 14:00
Mathematics, 14.09.2021 14:00

History, 14.09.2021 14:00
Social Studies, 14.09.2021 14:00

Mathematics, 14.09.2021 14:00
Mathematics, 14.09.2021 14:00


English, 14.09.2021 14:00
Mathematics, 14.09.2021 14:00
English, 14.09.2021 14:00
Mathematics, 14.09.2021 14:00
Mathematics, 14.09.2021 14:00


