
Mathematics, 24.05.2021 19:00 amara71
PLEASE I NEED HELP THIS IS A QUESTION FOR AP STATISTICS
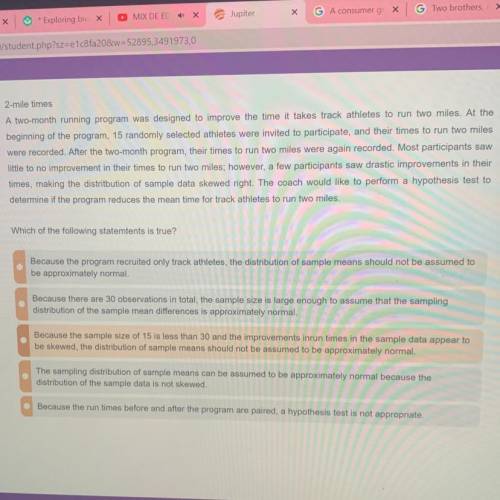
A two-month running program was designed to improve the time it takes track athletes to run two miles. At the
beginning of the program, 15 randomly selected athletes were invited to participate, and their times to run two miles
were recorded. After the two-month program, their times to run two miles were again recorded. Most participants saw little to no improvement in their times to run two miles; however, a few participants saw drastic improvements in their times, making the distritbution of sample data skewed right. The coach would like to perform a hypothesis test to
determine if the program reduces the mean time for track athletes to run two miles.
Which of the following statemtents is true?
a.)Because the program recruited only track athletes, the distribution of sample means should not be assumed to be approximately normal.
b.)Because there are 30 observations in total, the sample size large enough to assume that the sampling
distribution of the sample mean differences is approximately normal.
c.)Because the sample size of 15 is less than 30 and the improvements inrun times in the sample data appear to
be skewed, the distribution of sample means should not be assumed to be approximately normal.
d.) The sampling distribution of sample means can be assumed to be approximately normal because the
distribution of the sample data is not skewed.
e.) Because the run times before and after the program are paired, a hypothesis test is not appropriate.

Answers: 2
Another question on Mathematics
Mathematics, 21.06.2019 16:20
An equation representing lyle’s hedge-trimming business is a = 12n - 300 where a is the amount of profit or loss in dollars and n is the number of hedges trimmed. how would the graph of lyle’s business change if the equation a = 10n - 300 represented his business? the graph would be flatter. the graph would be steeper. the graph would start closer to the origin. the graph would start lower on the y-axis.
Answers: 2
Mathematics, 21.06.2019 21:00
List x1, x2, x3, x4 where xi is the midpoint endpoint of the five equal intervals used to estimate the area under the curve of f(x) between x = 0 and x = 10.
Answers: 1
Mathematics, 21.06.2019 21:00
At oaknoll school, 90 out of 270 students on computers. what percent of students at oak knoll school do not own computers? round the nearest tenth of a percent.
Answers: 1
Mathematics, 21.06.2019 21:50
Which equation shows the quadratic formula used correctly to solve 5x2 + 3x -4 0 for x? cos -3+ v (3) 2-4() 2(5) 3+ |(3)² +4() 205) 3+ (3) 2-4() -3+ v (3)² +4()
Answers: 1
You know the right answer?
PLEASE I NEED HELP THIS IS A QUESTION FOR AP STATISTICS
A two-month running program was designed to...
Questions
Mathematics, 20.09.2019 09:00

Social Studies, 20.09.2019 09:00


English, 20.09.2019 09:00


Biology, 20.09.2019 09:00

Chemistry, 20.09.2019 09:00
Biology, 20.09.2019 09:00

History, 20.09.2019 09:00
Mathematics, 20.09.2019 09:00
Social Studies, 20.09.2019 09:00
Mathematics, 20.09.2019 09:00
Chemistry, 20.09.2019 09:00


