These box plots show daily low temperatures for a sample
of days in two different towns.
Town...

Mathematics, 29.05.2021 01:00 andreyvaught2754
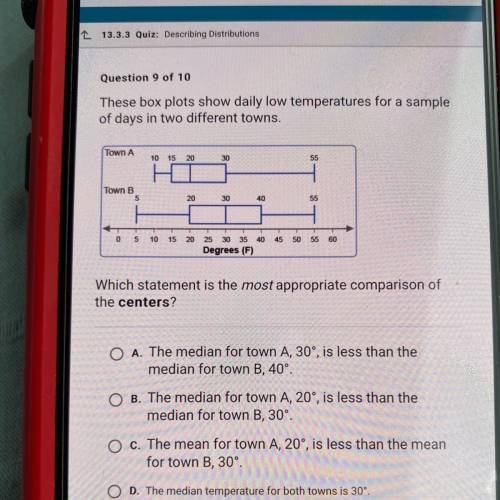
These box plots show daily low temperatures for a sample
of days in two different towns.
Town A
10 15 20
30
55
Town B
5
20
30
40
55
0
5
10
15
20
45
50
55 60
25 30 35 40
Degrees (F)
Which statement is the most appropriate comparison of
the centers?
O A. The median for town A, 30°, is less than the
median for town B, 40°.
B. The median for town A, 20°, is less than the
median for town B, 30°.
O c. The mean for town A, 20°, is less than the mean
for town B, 30°
O D. The median temperature for both towns is 30°.

Answers: 3
Another question on Mathematics
Mathematics, 22.06.2019 02:00
The line plot below represents the number of letters written to overseas pen pals by the students at the waverly middle school.each x represents 10 students. how many students wrote more than 6 and fewer than 20 letters. a.250 b.240 c.230 d.220
Answers: 1
You know the right answer?
Questions

Chemistry, 22.04.2021 01:00
Mathematics, 22.04.2021 01:00

Health, 22.04.2021 01:00
Mathematics, 22.04.2021 01:00
Health, 22.04.2021 01:00

World Languages, 22.04.2021 01:00

Spanish, 22.04.2021 01:00

Mathematics, 22.04.2021 01:00
Mathematics, 22.04.2021 01:00

Arts, 22.04.2021 01:00
Mathematics, 22.04.2021 01:00

Biology, 22.04.2021 01:00


