Mathematics, 13.02.2022 09:20 igivehead666
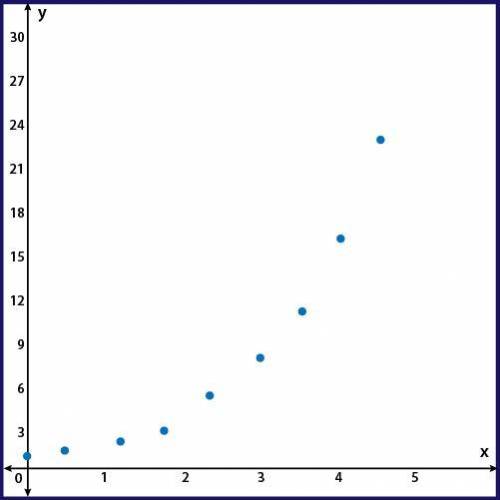
Given the scatter plot, choose the function that best fits the data.
scatter plot with data points that form an upward curve staring at the origin and continuing to the right
f(x) = 2x
f(x) = 2x
f(x) = −2x
f(x) = 2x2


Answers: 3
Another question on Mathematics

Mathematics, 21.06.2019 20:00
Landon wrote that 3−2.6=4. which statement about his answer is true?
Answers: 1

Mathematics, 21.06.2019 21:10
See attachment below and find the equivalent of tan(∠qsr)
Answers: 3

Mathematics, 21.06.2019 22:50
Jim had 15 minutes to do 5 laps around his school what would his time be
Answers: 1

Mathematics, 21.06.2019 23:30
What is the area of a triangle with a base of 7x and height of 8x expressed as a monomial? question 5 options: 1x 15x2 28x2 56x2
Answers: 1
You know the right answer?
Given the scatter plot, choose the function that best fits the data.
scatter plot with data points...
Questions


Mathematics, 17.11.2020 08:00

Biology, 17.11.2020 08:00


Mathematics, 17.11.2020 08:00


Biology, 17.11.2020 08:00


English, 17.11.2020 08:10

Chemistry, 17.11.2020 08:10

Mathematics, 17.11.2020 08:10


English, 17.11.2020 08:10

Mathematics, 17.11.2020 08:10


