
Mathematics, 21.07.2019 02:30 joesalem215
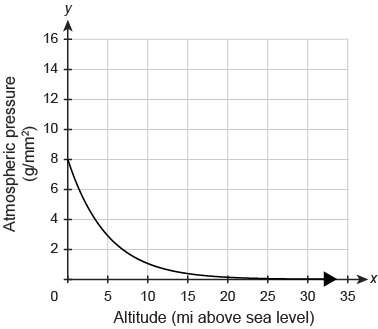
Need when an experiment began, the temperature of a substance was −5°c . during the experiment, the temperature rose exponentially. the scientist will sketch a graph of the situation, where x represents the time after the experiment began, and y represents the temperature of the substance at that time. the scientist will only sketch the graph in the quadrant or quadrants for which it makes sense to. in which quadrant or quadrants will the scientist sketch the graph? quadrant i only quadrants i, ii, iii, and iv quadrants i and ii only quadrants i and iv only the graph represents the atmospheric pressure, in grams per square millimeter, as a function of altitude in miles above sea level. which statements accurately reflect this relationship? select each correct answer. as the altitude decreases, the atmospheric pressure decreases. the atmospheric pressure is 8 g/mm2 at sea level. the atmospheric pressure gets close to 8 g/mm2 as the altitude continues to decrease. as the altitude decreases, the atmospheric pressure approaches 0 g/mm2 .

Answers: 2
Another question on Mathematics
Mathematics, 21.06.2019 17:30
How do you use the elimination method for this question? explain, because i really want to understand!
Answers: 1
Mathematics, 21.06.2019 19:40
Which of the following could be the ratio of the length of the longer leg 30-60-90 triangle to the length of its hypotenuse? check all that apply. a. 313 6 b. 3: 215 c. 18: 13 d. 1: 13 e. 13: 2 of. 3: 15
Answers: 3
You know the right answer?
Need when an experiment began, the temperature of a substance was −5°c . during the experiment, the...
Questions

Mathematics, 16.10.2019 19:00

Health, 16.10.2019 19:00

Business, 16.10.2019 19:00

Chemistry, 16.10.2019 19:00
English, 16.10.2019 19:00


Geography, 16.10.2019 19:00

Spanish, 16.10.2019 19:00

Social Studies, 16.10.2019 19:00
Engineering, 16.10.2019 19:00


