
Mathematics, 02.08.2019 14:30 juelchasse
When you multiply a function by –1, what is the effect on its graph?

Answers: 1
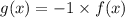

 , then the graph of function f(x) reflect across x-axis.
 , then the graph of function f(x) reflect across y-axis.
Another question on Mathematics
Mathematics, 21.06.2019 14:30
Fiona and her friends are playing a game by guessing where a coin will land when it is randomly dropped inside the square shown below. fiona guesses that the coin is likely to land in the blue area. which explains whether or not fiona is correct and why?
Answers: 1
Mathematics, 21.06.2019 16:00
Part one: measurements 1. measure your own height and arm span (from finger-tip to finger-tip) in inches. you will likely need some from a parent, guardian, or sibling to get accurate measurements. record your measurements on the "data record" document. use the "data record" to you complete part two of this project. name relationship to student x height in inches y arm span in inches archie dad 72 72 ginelle mom 65 66 sarah sister 64 65 meleah sister 66 3/4 67 rachel sister 53 1/2 53 emily auntie 66 1/2 66 hannah myself 66 1/2 69 part two: representation of data with plots 1. using graphing software of your choice, create a scatter plot of your data. predict the line of best fit, and sketch it on your graph. part three: the line of best fit include your scatter plot and the answers to the following questions in your word processing document 1. 1. which variable did you plot on the x-axis, and which variable did you plot on the y-axis? explain why you assigned the variables in that way. 2. write the equation of the line of best fit using the slope-intercept formula $y = mx + b$. show all your work, including the points used to determine the slope and how the equation was determined. 3. what does the slope of the line represent within the context of your graph? what does the y-intercept represent? 5. use the line of best fit to you to describe the data correlation.
Answers: 2
Mathematics, 21.06.2019 21:30
Mon wants to make 5 lbs of the sugar syrup. how much water and how much sugar does he need… …to make 5% syrup?
Answers: 2
Mathematics, 21.06.2019 21:40
Scores on the cognitive scale of the bayley-scales of infant and toddler development range from 1 to 19, with a standard deviation of 3. calculate the margin of error in estimating the true mean cognitive scale score, with 99% confidence, if there are 12 infants and toddlers in a sample.
Answers: 3
You know the right answer?
When you multiply a function by –1, what is the effect on its graph?...
Questions
Mathematics, 11.04.2020 17:41


Mathematics, 11.04.2020 17:46

English, 11.04.2020 17:54


Social Studies, 11.04.2020 17:54
English, 11.04.2020 17:54

English, 11.04.2020 17:55
History, 11.04.2020 17:55
Mathematics, 11.04.2020 17:55

Geography, 11.04.2020 17:55


